11. How to use the table tool
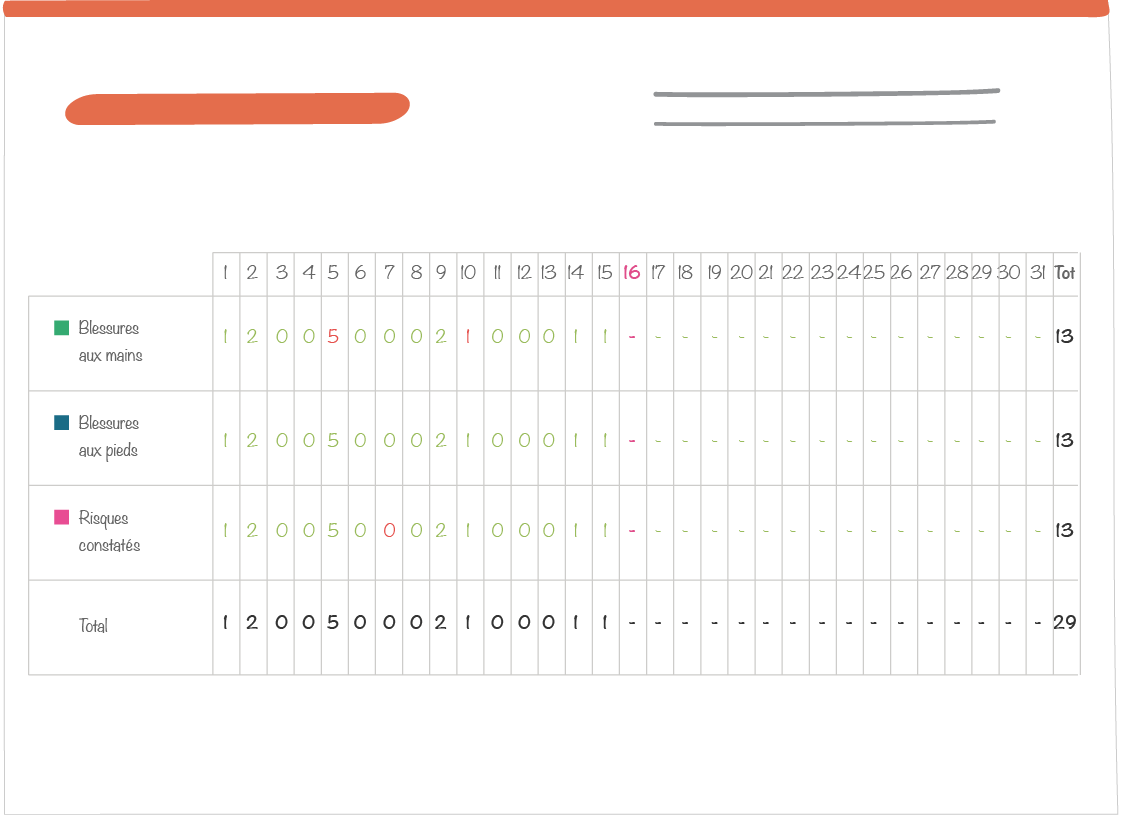
This tool shows the values of indicators linked to a letter in table mode:
- Indicators in rows
- Boxes in columns
- Values in cells
- Value colour code according to rules defined in indicators as well as the type of valuation
Note
Note :
- You can not generate a table with indicators belonging to concentric circles with different number of boxes (different types of ritual frequency or different numbers of boxes in custom cut-out) or with different labels (in case of custom cut-out )
- One of the advantages of the table tool is the use of box color codings defined in indicators regardless of the valuation type of the circle they belong to: even if it is represented in a “deactivated” way, its formula can be used by the table tool.
11.1. Special case of indicators included in several circles
If the user selects multiple circles that contain the same indicators, the latter will appear several times with the same name.
Note
To configure your circles, see this section: Dock Settings.
In the table, you can aggregate the values of these indicators in a single line. In this case, the value colour code will be displayed only if the colour code in the circles is the same.
11.2. Table tool set up
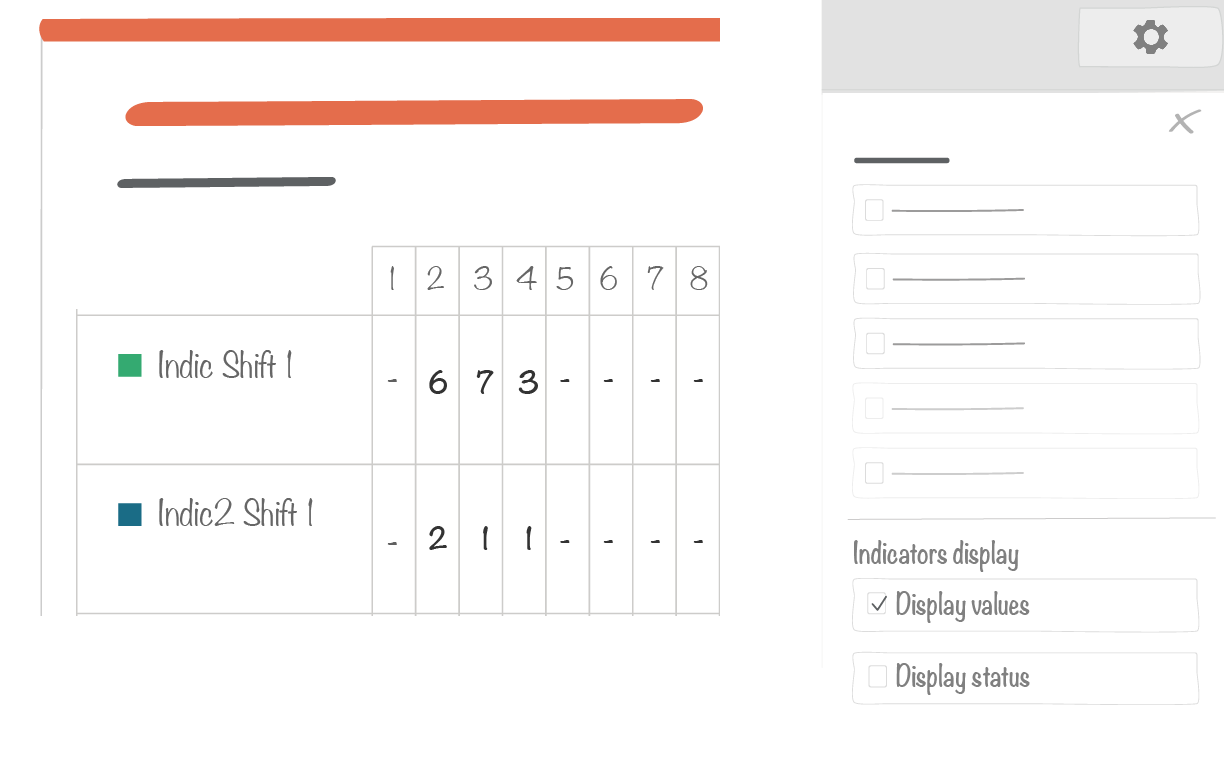
11.2.1. Data display set up
The “Set” button opens a window with a:
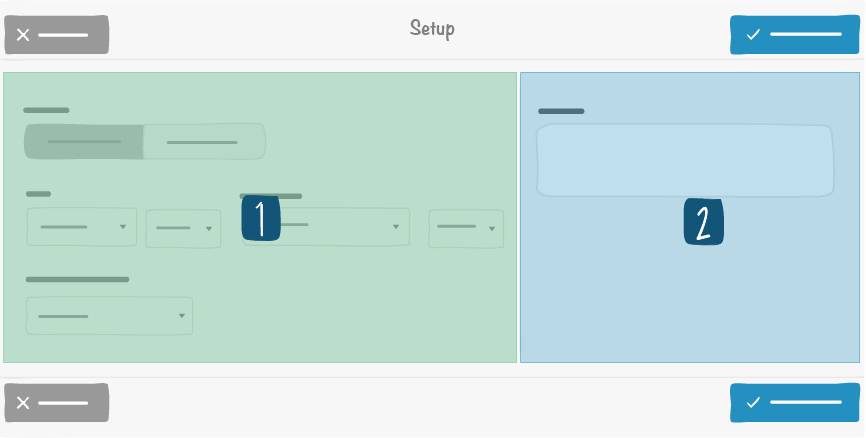
1 -> Left side
2 -> Right side
- Left side : short-term or long-term data visualisation. Long-term shows values from the letter historical data by aggregating them according to the selected option.
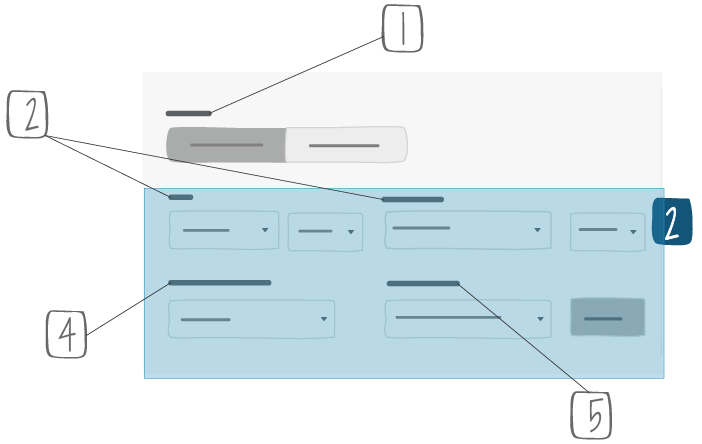
1 -> Short term tables show values from the current time window (ex.: January 2019, if we are in January 2019). Long term tables show values from a series of time windows (ex.: from January 2018 to December 2018)
2 -> Fields available for long term only
3 -> Beginning and end of long term time windows. Granularity of selection depends on board time window (ex.: a monthly board time window will allow you to select only months as a beginning or end of your long term time window)
4 - > Calculation rules for indicator cumulated values
5 -> Threshold visualization: global or by indicator
- Right side : a description that will appear at the top right of the item.
11.2.2. Table layout

to :
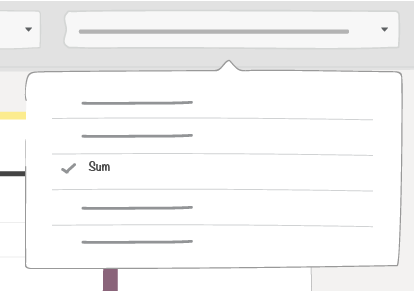
You can display the totals:
- the total of the columns,
- the cumulative total of the lines,
- the total of the lines.
You can display the averages:
- the average of the columns,
- the average of the lines.
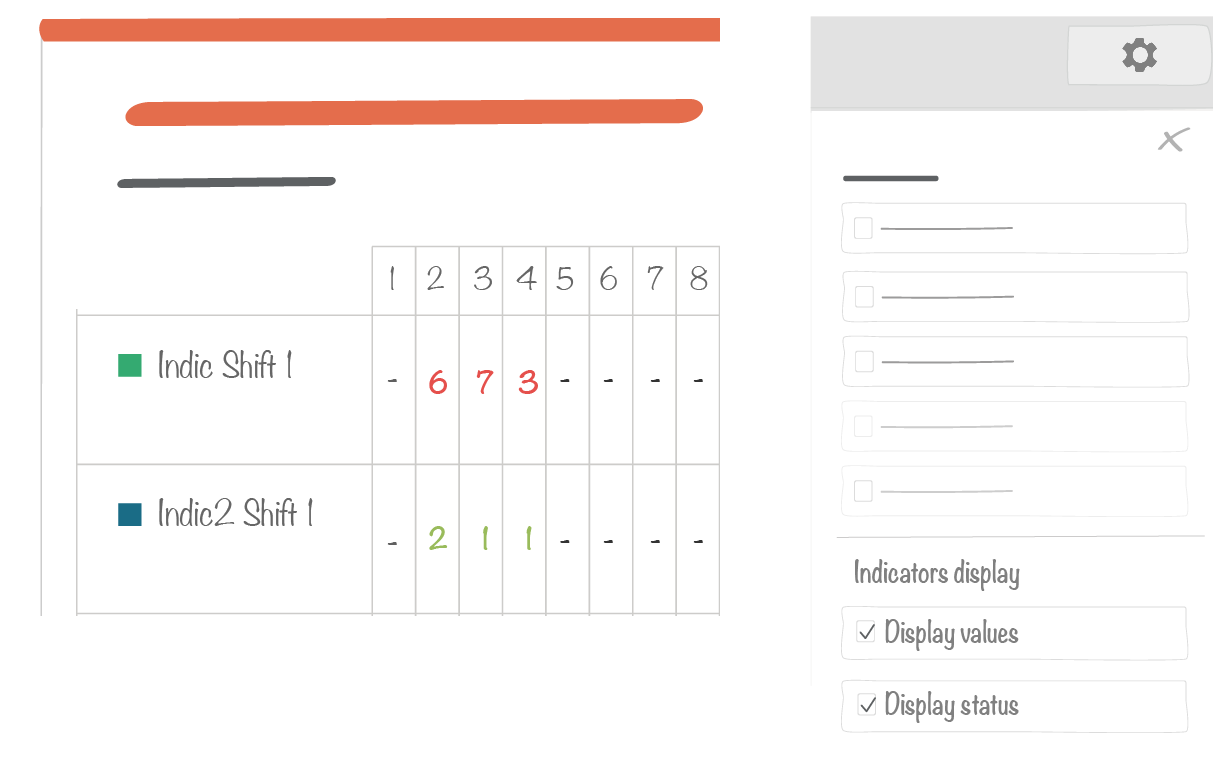
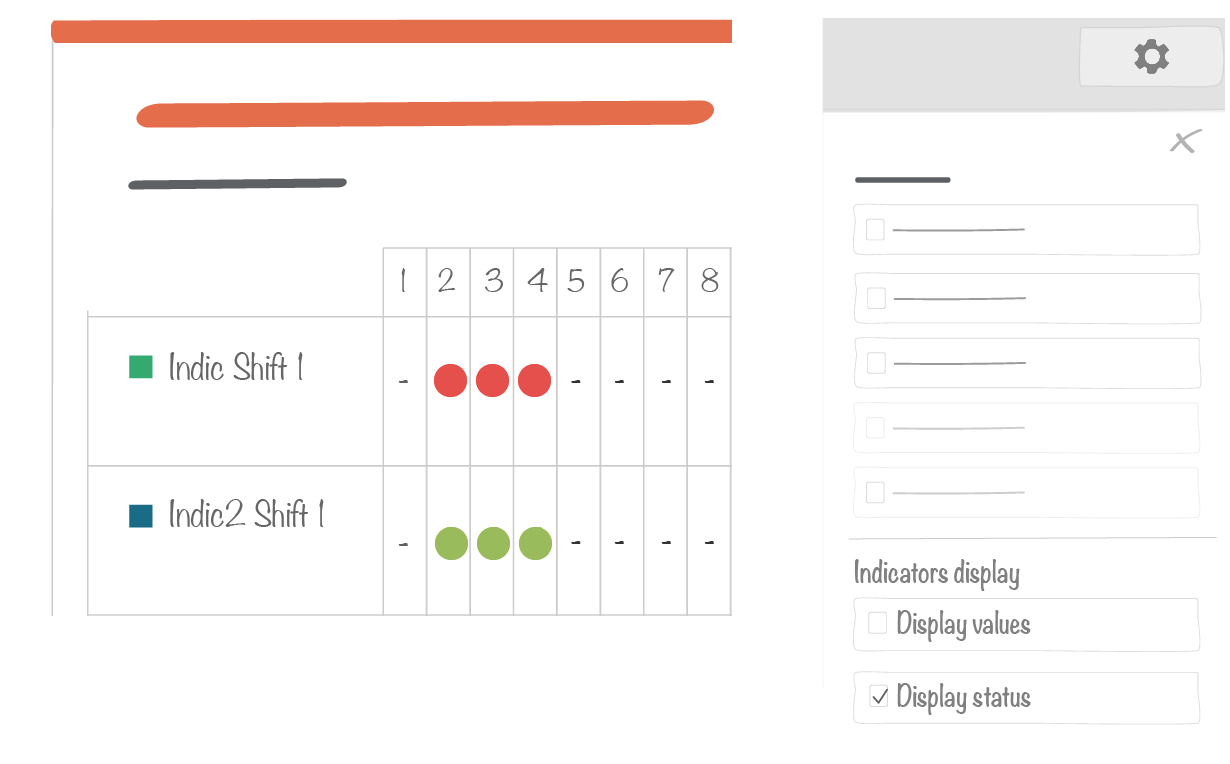
Note
If you select Values + Status, the values appear colored.
If you select only Values, only the values are displayed.
If you select only Status, only colored dots are displayed.
If you select only Status and the cell does not contain a value, a black dot is displayed.
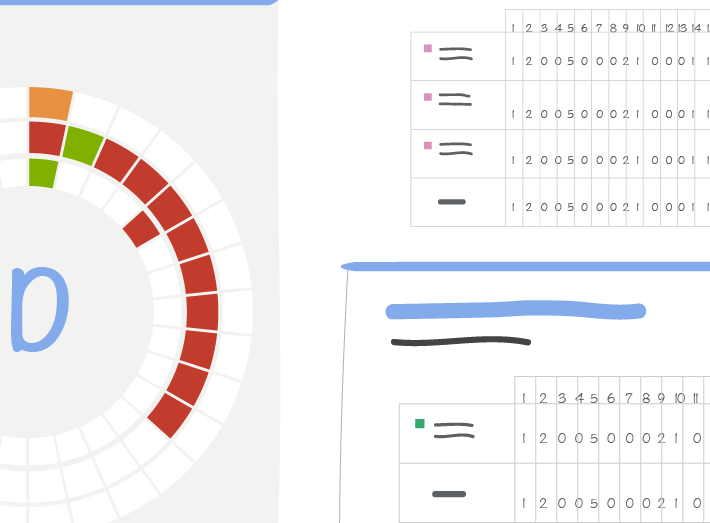
11.3. Visual appearence in short-term mode
The following example is based on these settings:
- 3 circles
- 2 common indicators for the first 2 circles:
- ‘Indic’ with threshold of 1
- “Indic2” with a threshold of 2
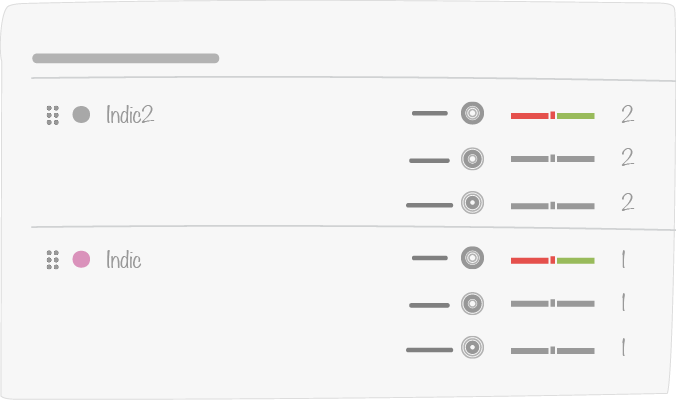
11.3.1. Show values and statuses
11.3.2. Show statuses only
11.3.3. Show values only
11.3.4. Total line display
11.3.4.1. Color coding by threshold (single indicator)
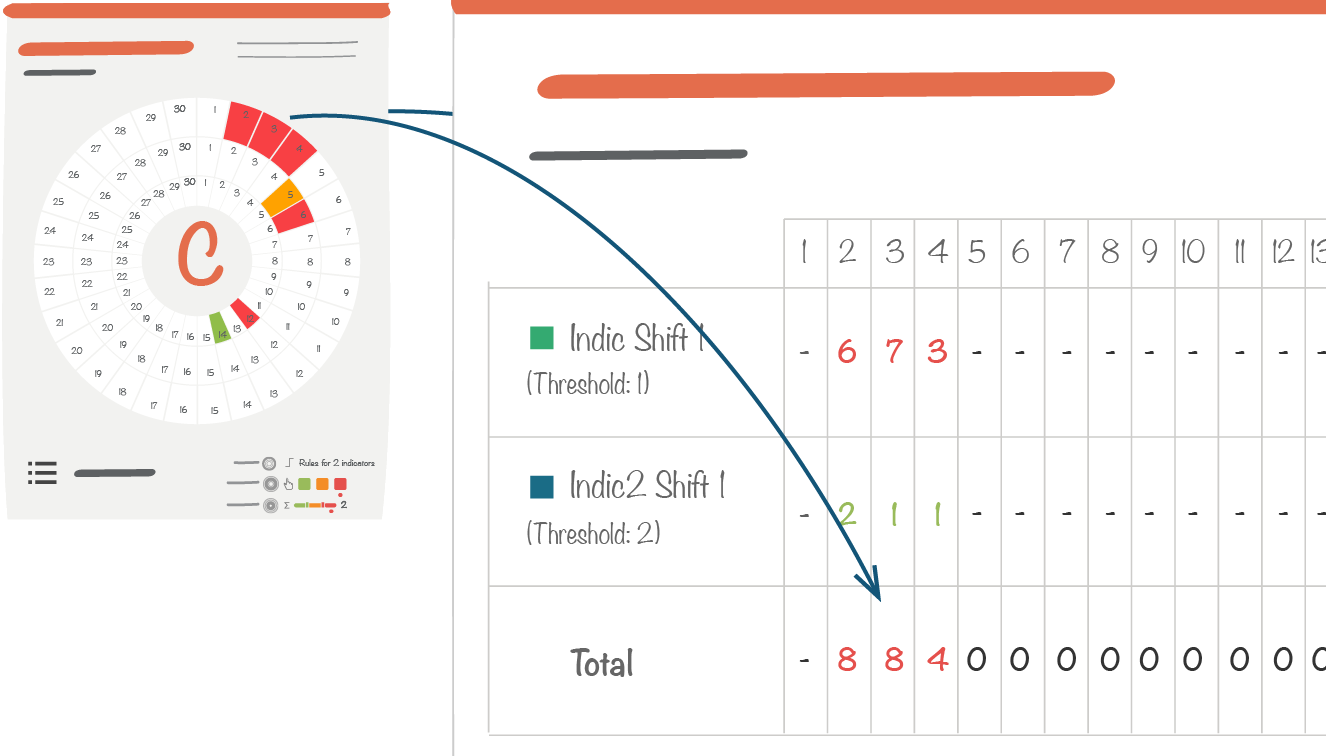
- Indicators follow their color code rules
- Total value is colored
11.3.4.2. Manual color coding
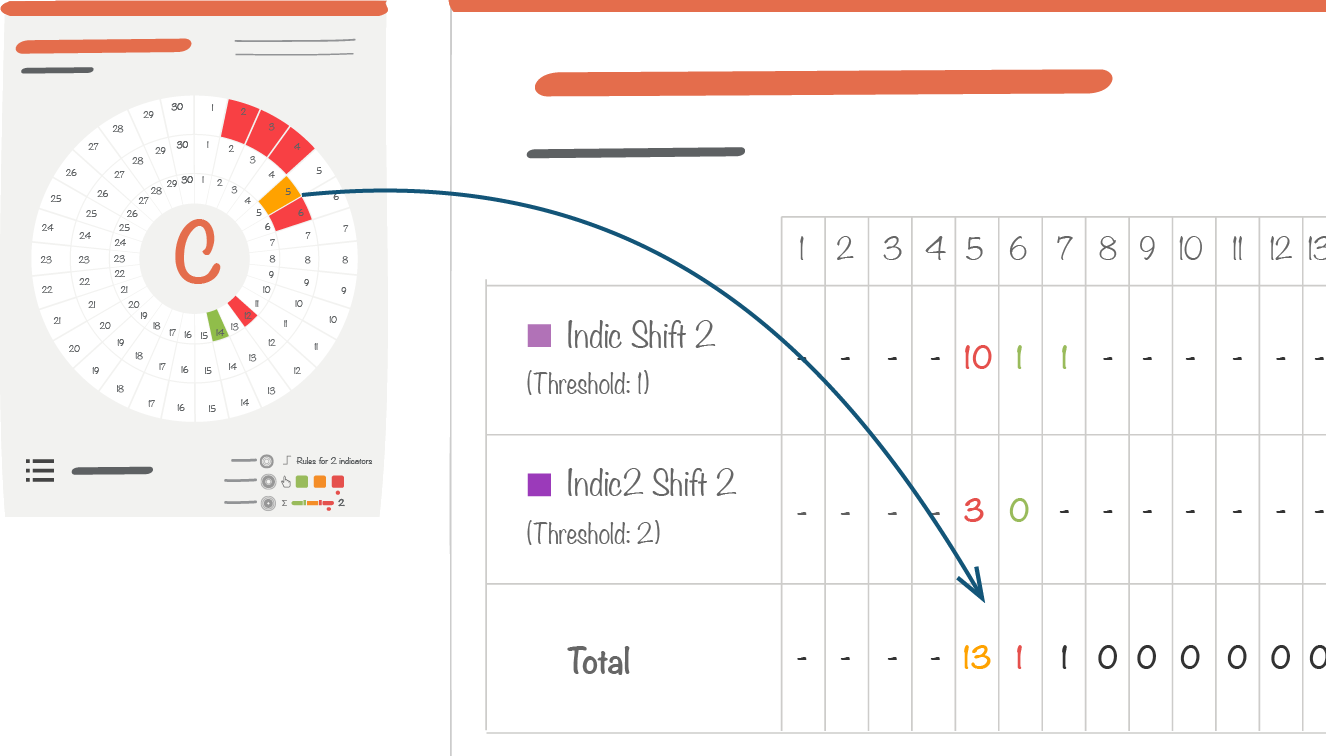
- Indicators follow their color code rules
- Total will automatically given the same the box color, manually defined
11.3.4.3. Color coding by threshold (global)
- Indicators follow their color code rules
- Total will be given a color according the global rule
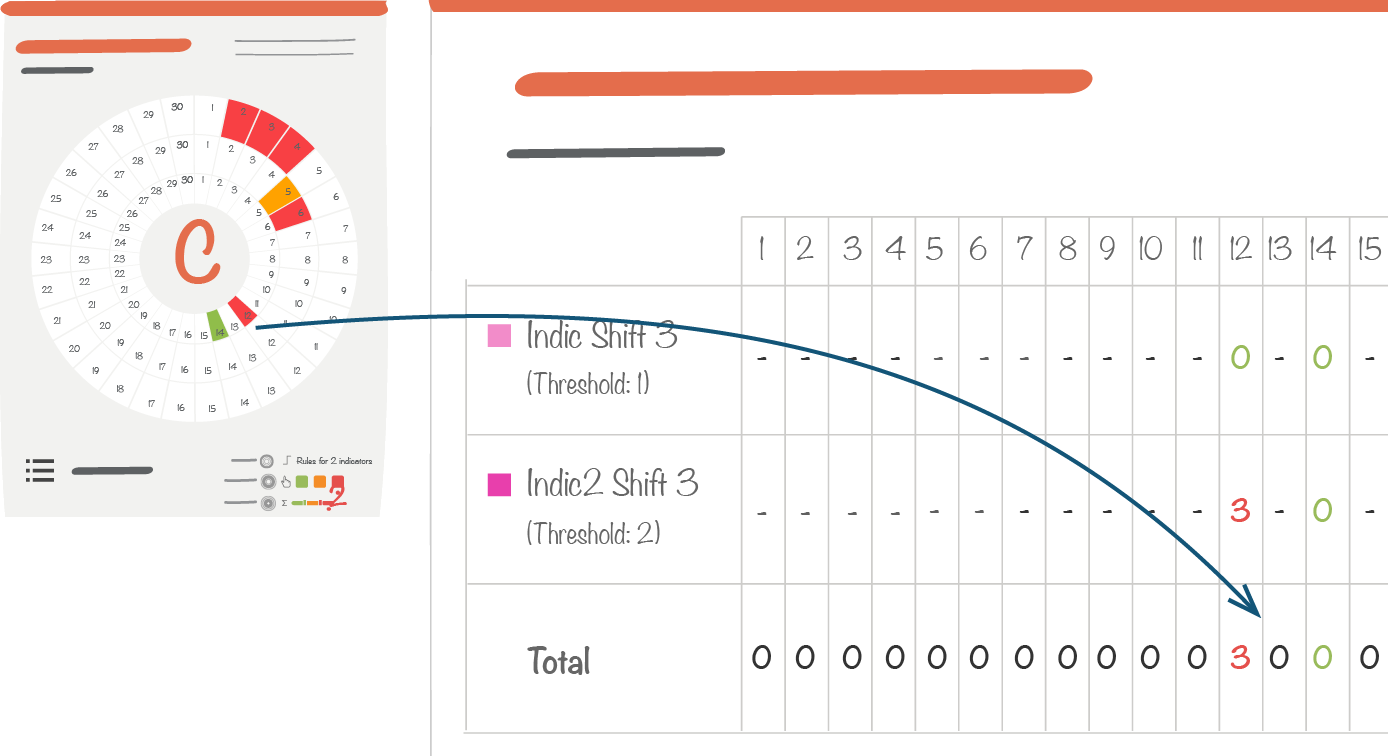
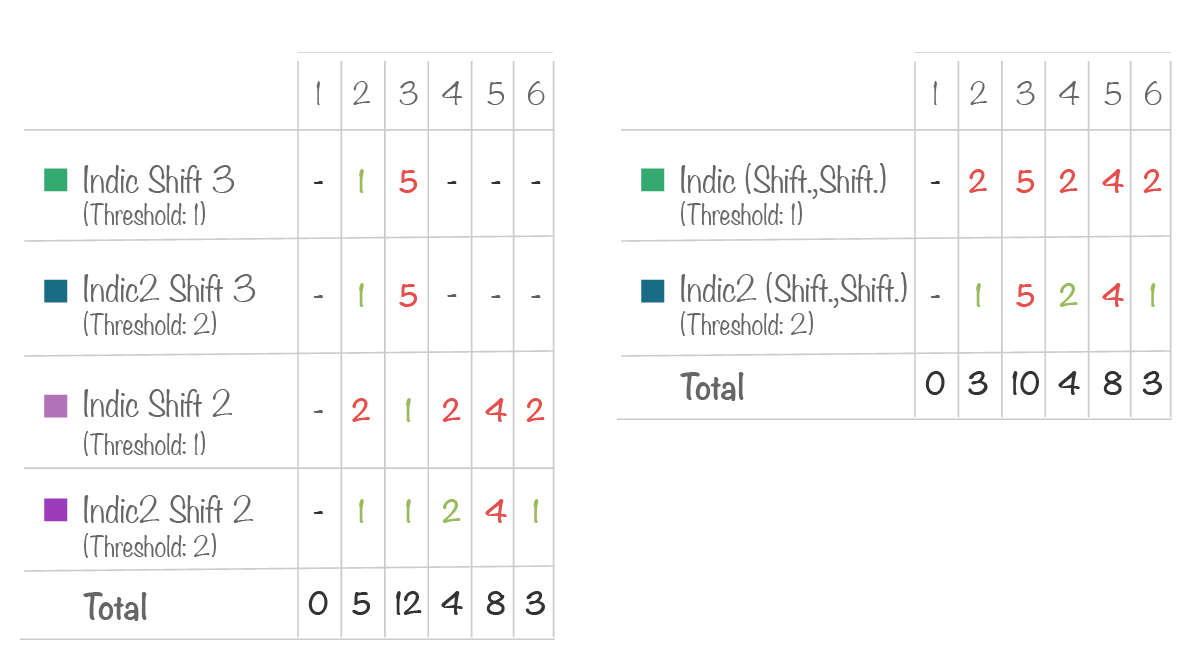
11.3.4.4. All letter indicators with three different color coding rules
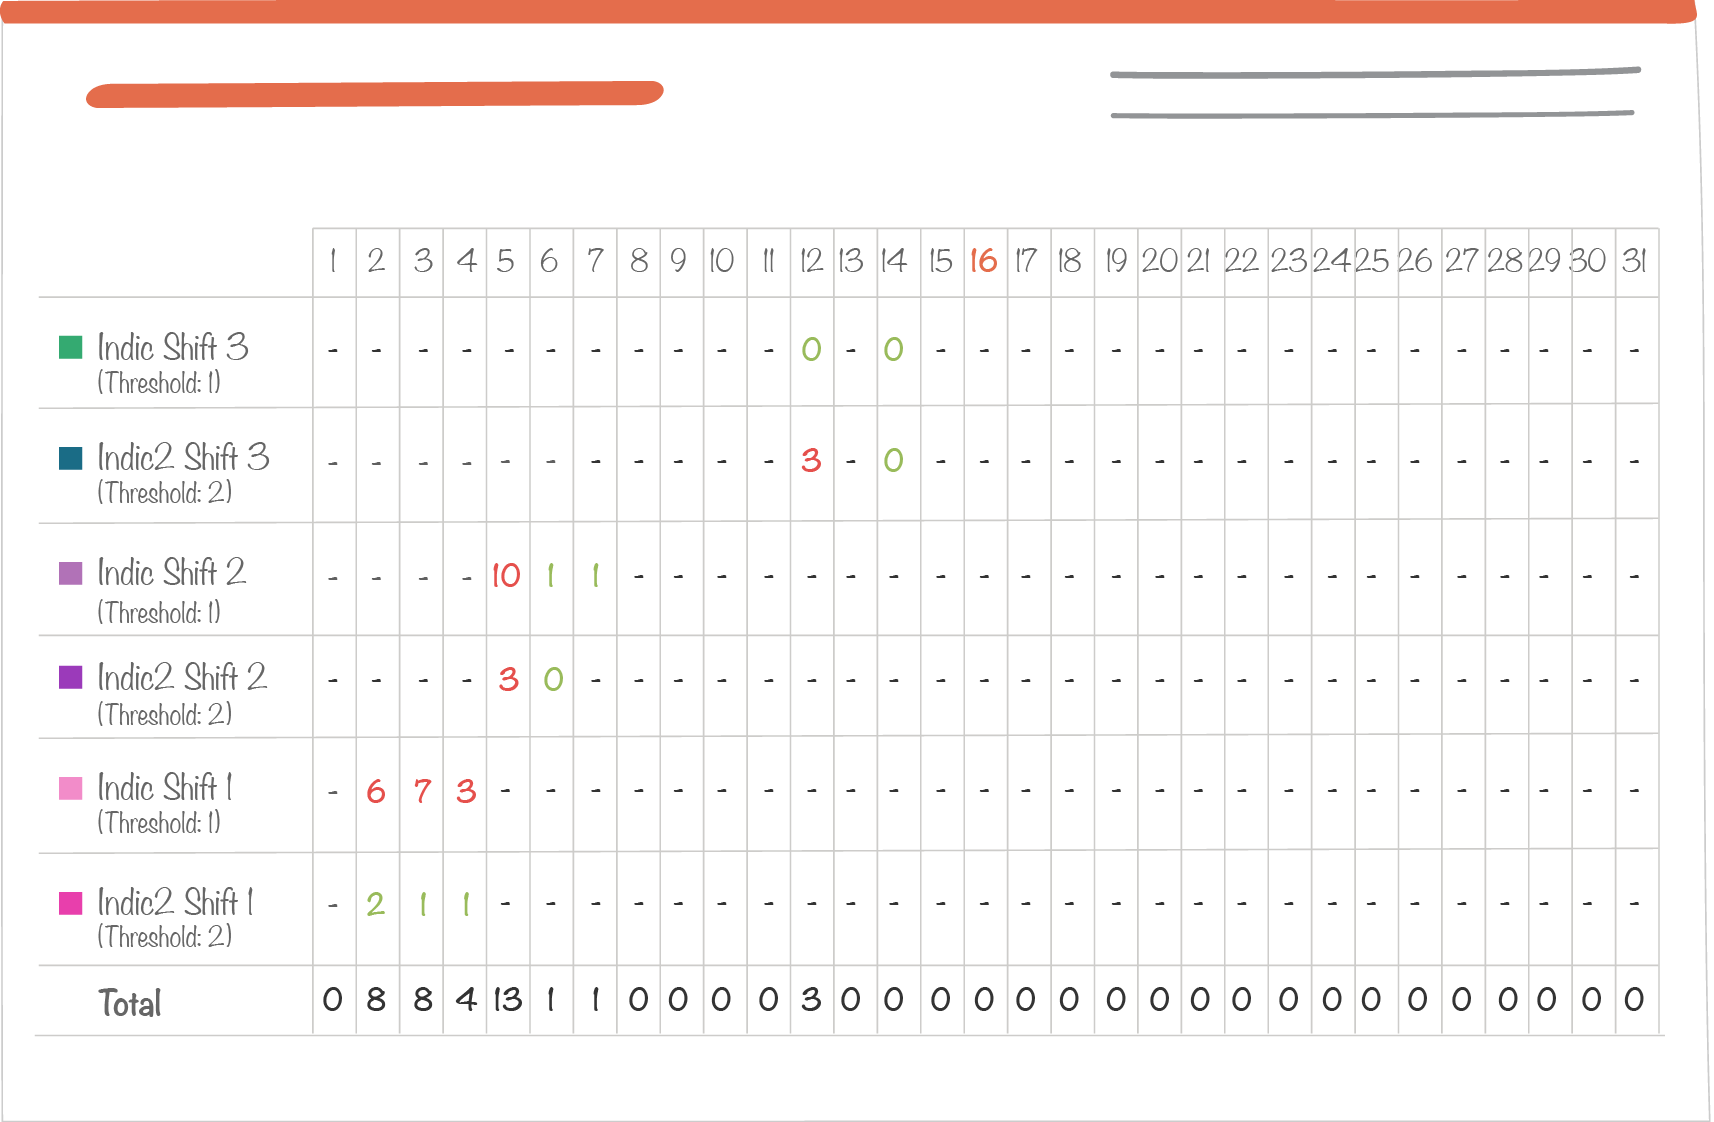
- Each indicator follows its own color coding rule
- Total will be given no color as it combines values from circles with different color coding rules.
11.4. Visual appearece in long-term mode
Note
Note :
- In a long-term mode, thresholds of single indicators will not be displayed. This is because for a single indicator the threshold can change over time, from one (short term) time window to another.
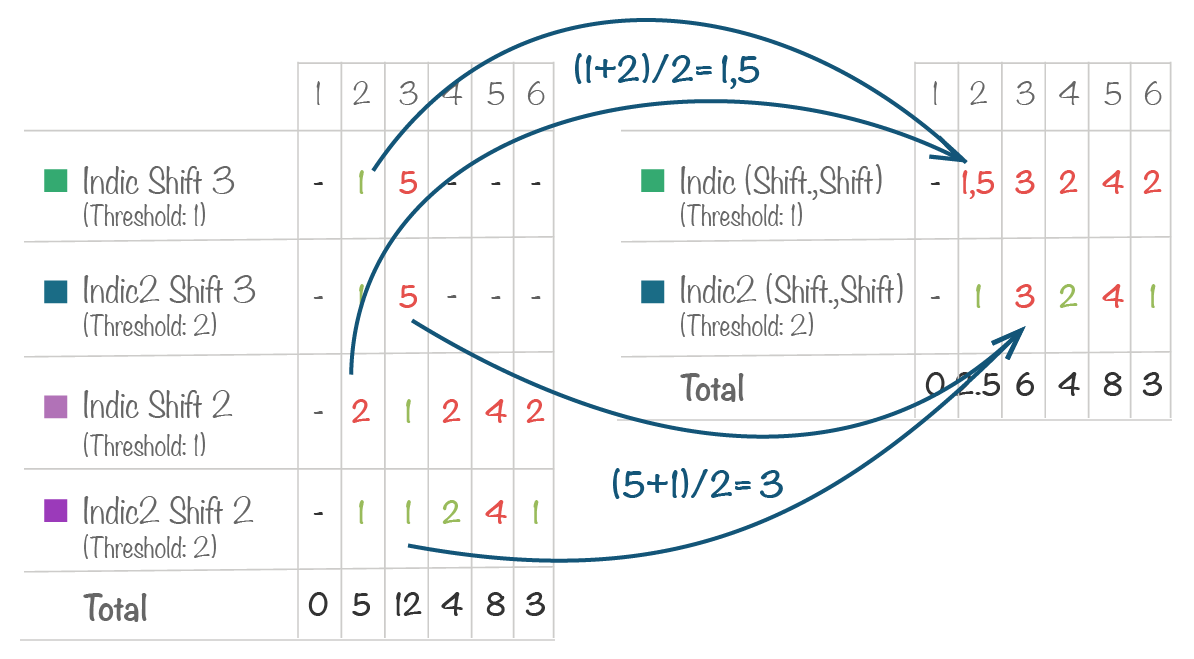
- However, in a long term mode, changing thresholds of single indicators can be aggregated. Example : indicator A has a threshold of 10 in January (short term time window) and 20 in February (short term time window). Indicator B has a threshold of 8 in January and 30 in february. In a long term mode, if you choose average as an aggregation option, the threshold will be of 9 in January and 25 in February. In a given time window, thresholds are aggregated as many times as the number of cells with a value. The aggregation is done according to the aggregation option selected in the table tool set up window.
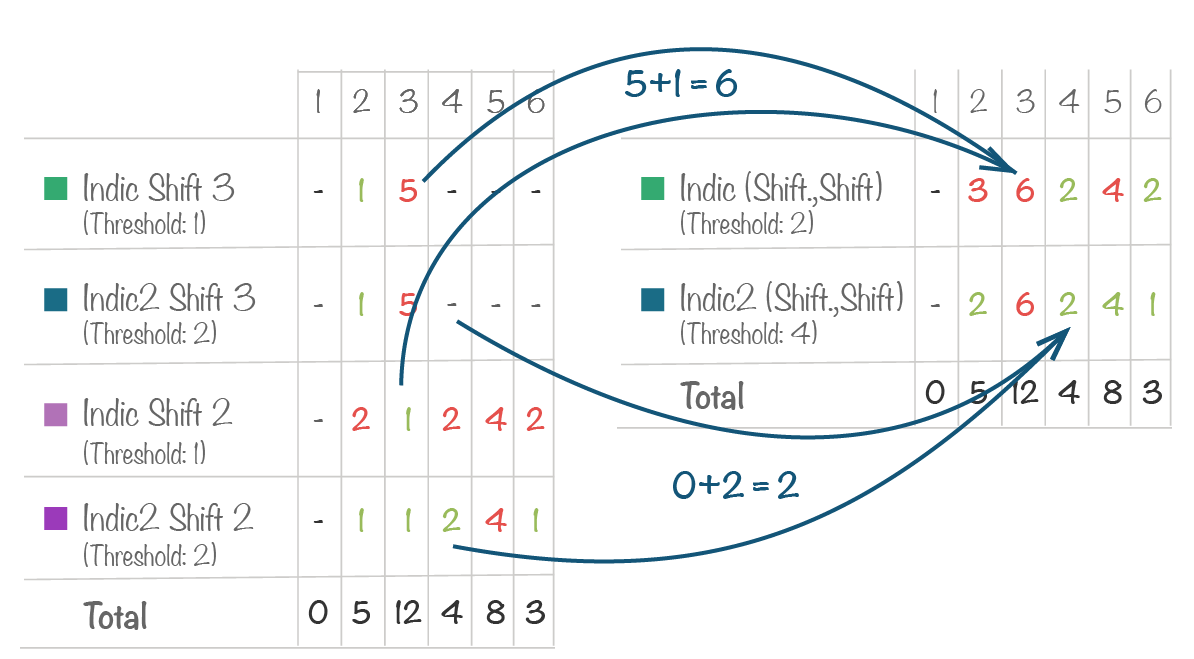
11.4.1. Threshold aggregation
Aggregation is linked to the long-term aggregation option.
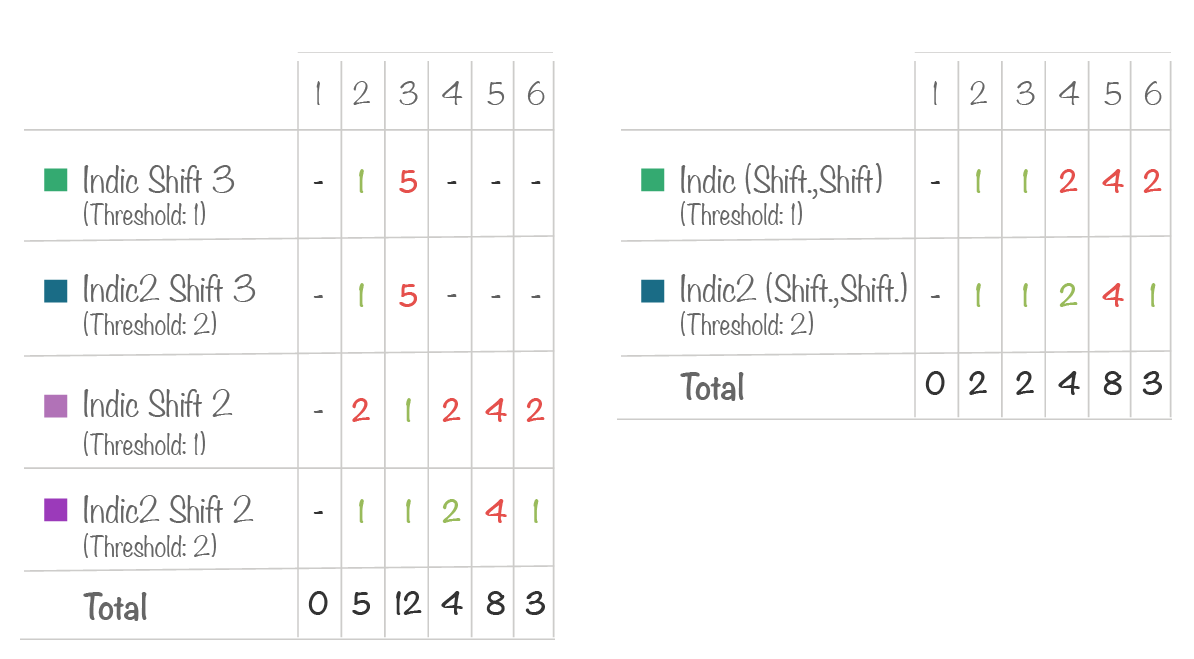
By default, for a given long-term time window, indicator values and their thresholds will be added. Then, these results can be aggregated in other ways by selecting an aggregation option.
See related examples in appendix .