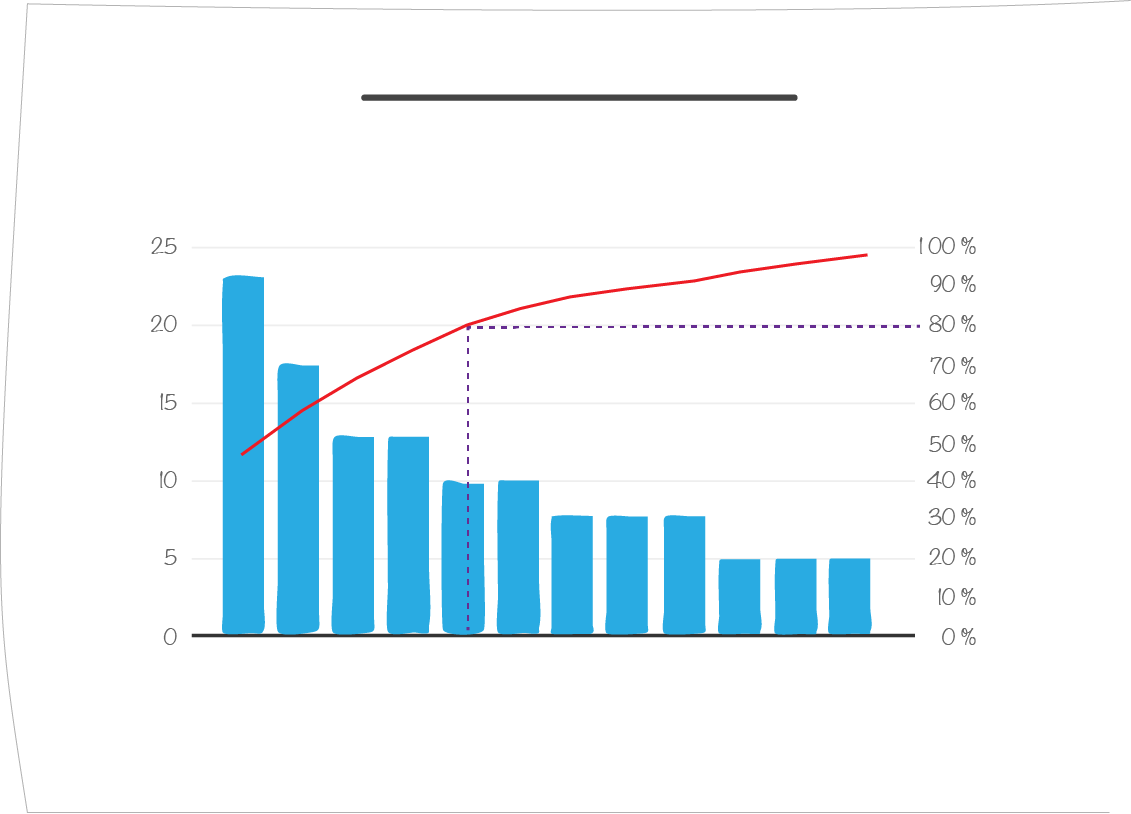
13. Using the Pareto chart
The tool is specially designed for actions on a QCD board. It provides a graphical analysis of the 20% of causes responsible for 80% of the problems created on a QCD board.
The tool is present by default in your board’s DOCK. It is also available in iObeya’s QCD tools catalog. Once in the DOCK, simply drag and drop it onto the board and start configuring the Pareto chart.
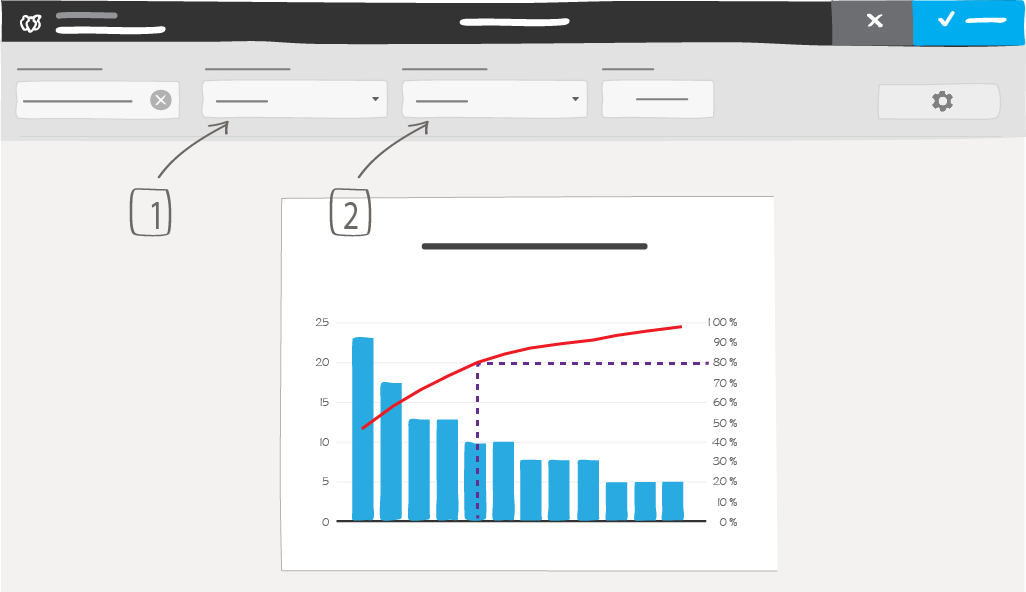
1 -> X-axis with first filter
2 -> Refine pareto with a second filter
You can define the X axes of this diagram by choosing the first filter, which corresponds to the same options as those present on QCD action plans. With the second filter, you can refine this Pareto chart and choose color combinations identical to those on QCD charts.
Note
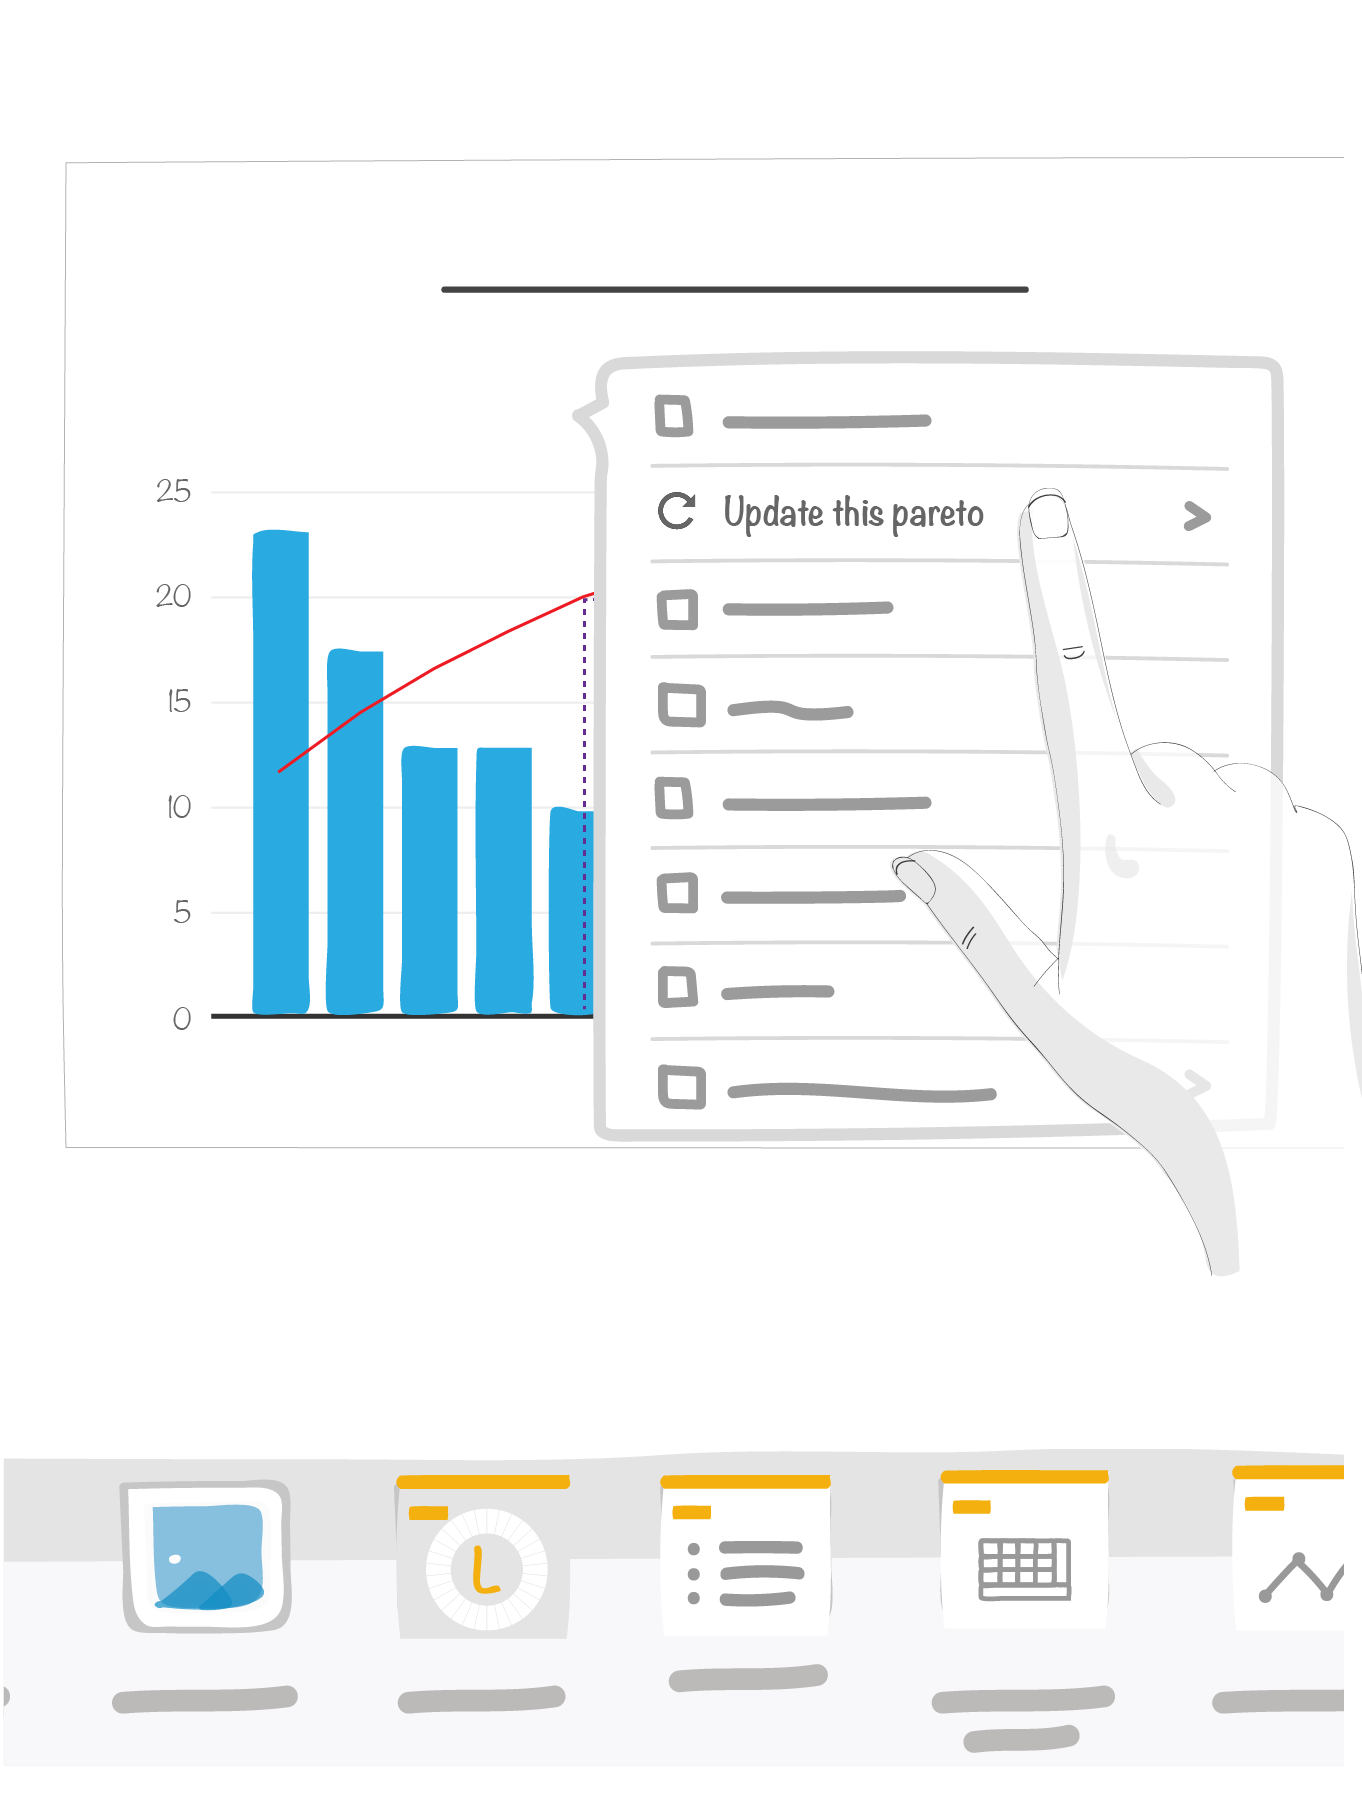
- This Pareto diagram only works at the board level and with the actions present on that board, whether or not they are linked to a letter, escalated or simply present within a letter.
- This diagram is not updated automatically at present, but you can update it manually by clicking on the option in the contextual menu.
- For the moment, the Pareto chart is not displayed when the guided animation is in use.