12. Historical Data Management
By default, when a letter is created, the time window historical data start with is the current (short term) time window.
Examples:
| . | Date value according to the type of time window | ||
|---|---|---|---|
| Current date | Annually | Quarterly | Weekly |
| January 1st, 2018 | 2018 | Q1 | W1 |
| July 14th, 2019 | 2019 | Q3 | W28 |
These default settings for viewing past data can be changed and they will be automatically saved.
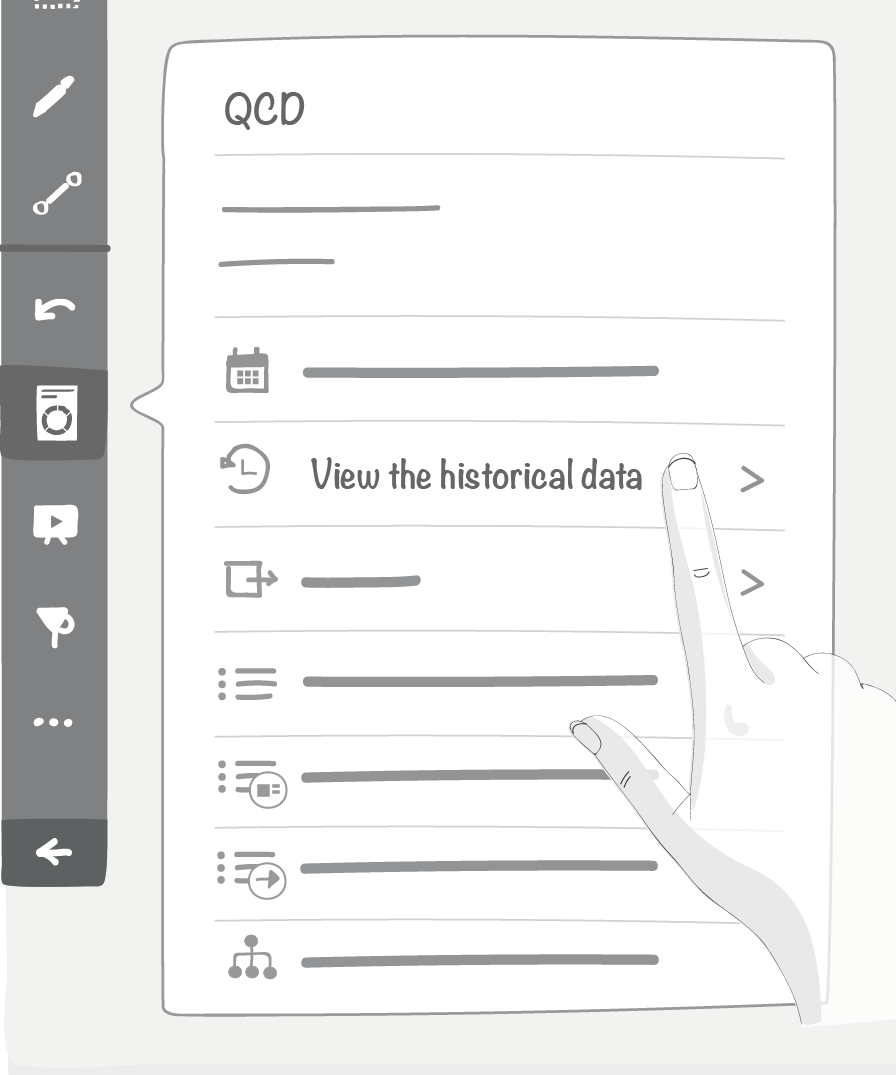
12.1. View of Historical Data
You can access historical data from the utility bar on the left hand side of the screen. By selecting a new time window, all historical data are retrieved and the board elements are automatically updated.
12.2. How to change a time window to view historical data
You can change time window from the utility, by selecting the options shown below according to the frequency set on the board.
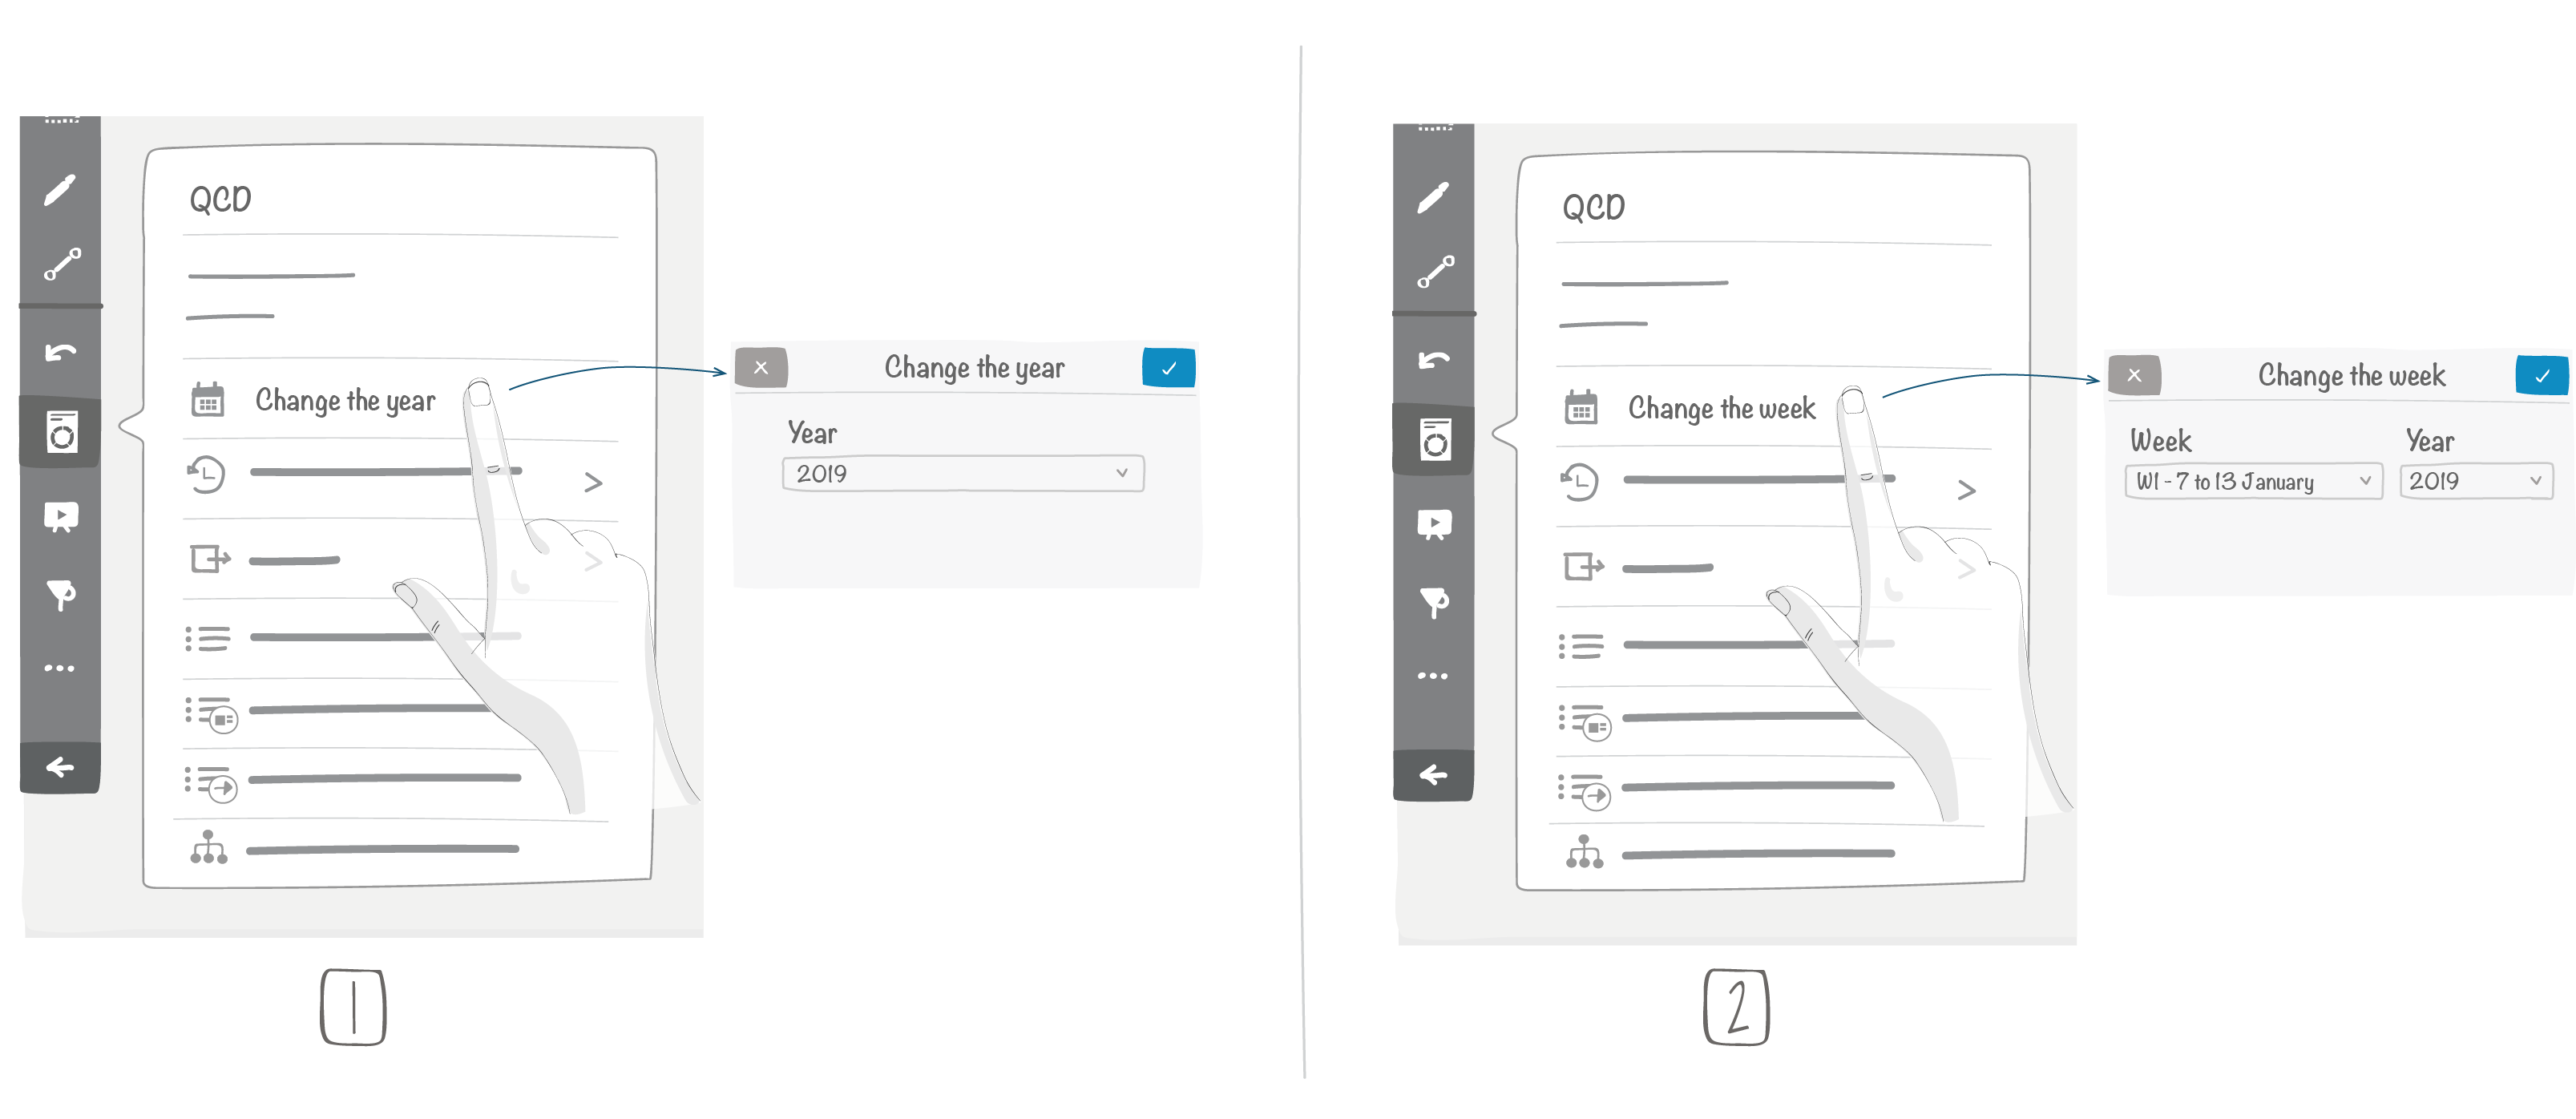
Annual frequency
Weekly frequency
Note
Every time you change (short term) time window:
- will be saved:
- The list of indicators
- Indicator thresholds
- The letter description
- will not be saved:
- Global thresholds
- Actions
- The QCD Table description
- The QCD Chart description
- can be saved:
Indicator values over time can be displayed in both graphs and tables in a long-term mode.