Accessing Platform Information
Introduction
This chapter presents the different tools that allow platform administrators to monitor the iObeya platform.
This information can be highly useful when you need to contact the iObeya Support team when you encounter an issue with iObeya.
As a platform administrator, you can:
- Access and download application logs.
- Access and download global system information.
- Monitor the platform, by consulting the time used for different requests.
- Access and download connection logs.
Accessing Administrative Logs
Platform administrators can download the application logs from the administration interface (for support or maintenance purposes, for example). They are downloaded from the server into a ZIP file.
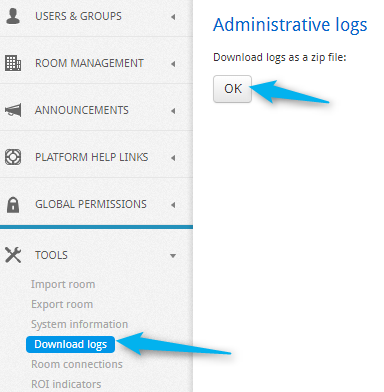
On the left-hand side menu of the administration interface, select Download logs in the TOOLS section.
Select OK.

A ZIP file is downloaded, containing the log files.
- app.log
Logs the details (INFO, WARN, ERROR, FATAL).
- error.log
Logs every error detail (ERROR, FATAL).
- struts.log
Framework logs.
- UserAndGroup.log
Logs all permission changes.
Here are the different detail levels you can find in logs:
- FATAL
- Used to log an error that can lead to a premature application shutdown.
- ERROR
- Used to log an error that does not prevent the application from running.
- WARN
- Used to log a warning. For example, it may refer to an inconsistency in the configuration. The application can continue to operate, but not necessarily as expected.
- INFO
- Used to log informational messages.
- DEBUG
- Used to generate messages that can be useful in debugging.
Accessing System Information
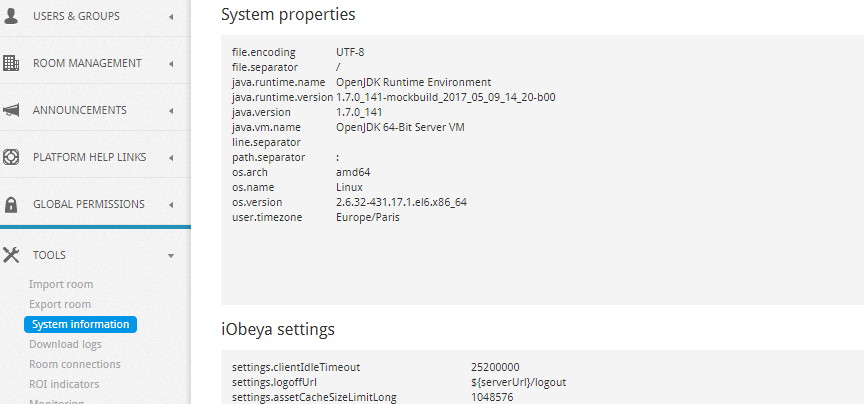
A page to help the support of the application now exists in the administration interface.
System information can be found in the TOOLS section.

The page is divided in four sections:
- System information
- Application version
- Operating system version
- Time zone
- Server
- iObeya settings:
- Application path
- Application settings
- Application information:
- Number of domains, rooms, boards, users, groups
- Database information
- Storage information
- Hibernate properties:
- Cache parameter
Alternatively, you can download all this information into a CSV file format by clicking on Download all at the bottom of the page:

Monitoring Your Platform
If installed, select the Monitoring link in the left-hand side TOOLS section of the menu.
A platform administrator can also access the add-on by clicking on the ADD-ONS section, then clicking on the configuration wheel of monitoring-plugin.
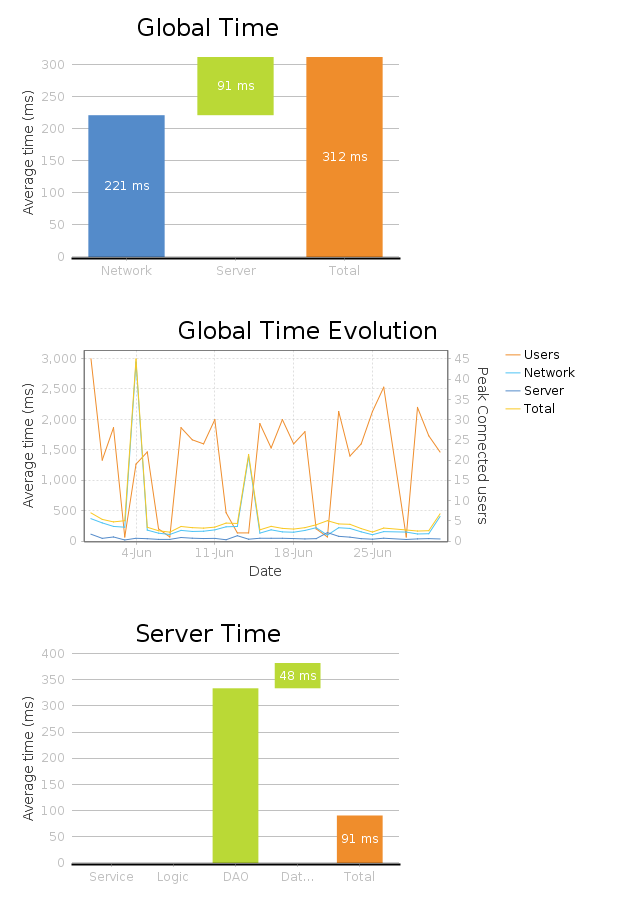
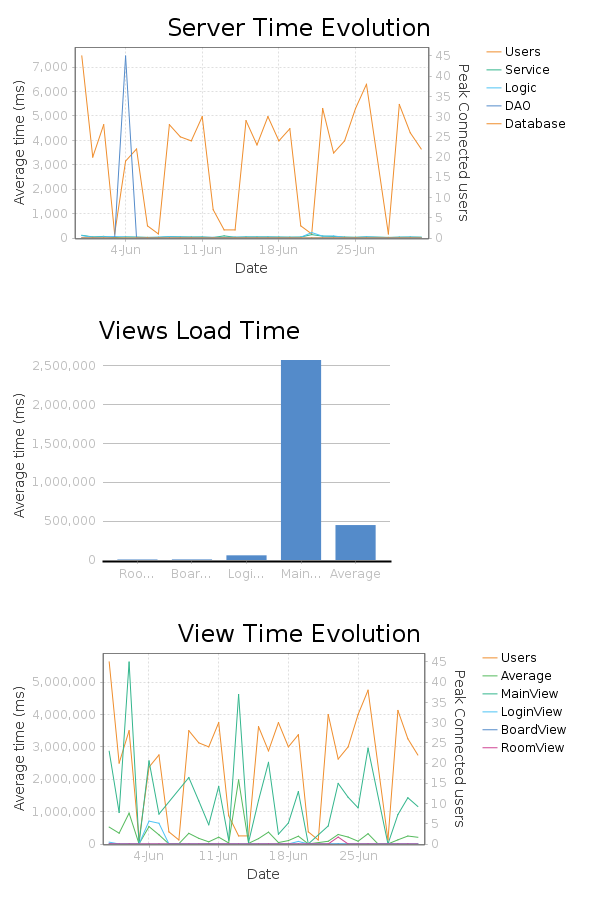
This add-on is a monitoring tool, which will be useful for a global overview of the platform’s performance (different response times displayed in charts and detailed lists).
For each tab, a platform administrator can select the period they choose to monitor:
- All (since the activation of the add-on)
- This month
- This week
- Today
- Current
Dashboard
This first tab is a dashboard displaying the main statistics concerning activity and performance.


Select Enable/Disable monitoring to start/stop collecting information for monitoring.
Select Take snapshot to manually transfer the collected data (current) into historical data (All, This month, This week, Today). This task is automatically completed by the Instrumentation job (Refer to Jobs to see/edit the configuration of this job).
All Statistics
This page contains a table listing all queries with certain statistics: number of hits, average time, total time, last value, minimum value, maximum value, enabled, primary.
Slowest Queries
A list of the SQL queries which lasted more than 100 ms. A maximum of 50 are saved each day.
Exception Details
A list of the exceptions that occurred on the server, which can be useful when combined with the server logs, to identify and fix performance issues.
Accessing Platform Analytics
- From the platform administration homepage, click TOOLS section in the left-hand side menu.
- Select Platform analytics.
This page allows the platform administrator to download room metrics and user connection logs (including guest users in public rooms), and generate statistics and metrics using the information it contains.
Once a report has been downloaded, open it in your favorite data visulization tool to further analyze information about unused rooms, the appropriation rate of the application, or any other information that can be mined from the data.
Tip
You can use an external tool such as Excel or Power BI to manipulate and visualize your data.
- Room metrics
This section allows you to retrieve detailed information about the rooms on your platform. You can download a ZIP file generated once a day.
You can retrieve room metrics only for cloud platforms.
To activate this feature, contact our Support team (support@iobeya.com).
The file contains a CSV report providing the following information.
| Field | Type | Default value | Description |
|---|---|---|---|
| admin_number | integer | How many users have administrative rights in the room | |
| admins_list | stirng | List of email adresses (comma separated) for the users with administrative rights in the room | |
| board_rate | decimal | How much a room is used based on the number of boards (i.e. nb_boards / max_boards) | |
| category | string | Information entered in the category field when creating a room (e.g. Business Unit, Country, Location, Site) | |
| closing_date | date | Closing date of a room that has been archived or that will be archived in the future | |
| creation_date | date | Creation date of the room, room template or instant whiteboarding session | |
| creator_email | string | Email of the room creator to contact him | |
| date_collect | date | Creation date of the room metrics extract. Combine multiple extracts to compare data and identify trends. | |
| description | string | Information entered in the description field when creating a room | |
| domain | string | Identify to which domain a room belongs. Domain can be used to group room by entity, location, subsidiaries or any other organizationnal logic. | |
| id | string | Unique room id number that can be used for tracking purposes (e.g reference Room ID in an ITSM tool for instance, so that even if the room name changes over time, the ID remains the same) | |
| instant_meeting_room_id | string | Identify each instant meeting by a unique ID that is different from the room ID | |
| is_archived | boolean | false | Identify how many rooms are archived on the platform |
| is_deleted | boolean | 0 | Identify deleted rooms that will be purged by the purge job which runs once a day |
| is_instant_meeting | boolean | 0 | Identify rooms that have been created to host an instant whiteboarding session |
| is_model | boolean | false | Identify room models on the platform |
| is_public | boolean | false | Identify whether a room is public or not |
| last_board_modification_date | date | Identify if a room is active or not based on the last modification date of a board in that room | |
| last_connection | date | Identify if a room is active or not based on the last connection date. This may be empty if the user that last visited the room has been deleted. | |
| last_element_modification_date | date | Identify if a room is active or not based on the last modification date of a board element in that room | |
| max_boards | integer | Max number of boards allowed in the room | |
| max_users | integer | Max number of users allowed to have “can_edit” permission in the room | |
| modification_date | date | Identify if a room is active or not based on the last modification. This date changes on various actions such as add a new board created or a parameter that has been changed by the room administrator. | |
| name | string | Room name | |
| nb_ado_boards | integer | Number of Azure DevOps boards in the room | |
| nb_blank_backgrounds | integer | 0 | Number of boards using a blank background |
| nb_blank_boards | integer | Number of default whiteboards in the room | |
| nb_boards | integer | Number of boards on the wall | |
| nb_connections | integer | Total number of connections in the room. Users that have been deleted are not taken into account. | |
| nb_custom_backgrounds | integer | 0 | Number of boards using a custom images as a background |
| nb_custom_catalog_backgrounds | integer | 0 | Number of boards using a custom template as a background |
| nb_dcm_boards | integer | Number of micro-planification boards using DCM in the room | |
| nb_guest | integer | Number of users that are granted ONLY “can_use” permission to the room. Users from groups are ignored. | |
| nb_jira_boards | integer | Number of Jira boards in the room | |
| nb_kankan_boards | integer | Number of kanban boards in the room | |
| nb_live_days | integer | Number of days since the room has been created | |
| nb_model_boards | integer | Number of board templates available in the configuration of the room | |
| nb_planning_boards | integer | Number of planning boards in the room | |
| nb_qcd_boards | integer | Number of QCD boards in the room | |
| nb_safe_program_boards | integer | Number of SAFe® Program boards in the room | |
| nb_safe_team_boards | integer | Number of SAFe® Team boards in the room | |
| nb_shared_boards | integer | Number of boards on the wall that are shared from/to the room | |
| nb_standard_catalog_backgrounds | integer | 0 | Number of boards using a standard template as a background |
| nb_users | integer | Number of users that are granted “can_edit” permission to the room. Users from groups are ignored. | |
| nb_visitors_since_30_days | integer | Total number of connections in the last 30days. Users that have been deleted are not taken into account. | |
| room_type | string | Allow to differenciate the different types of room. The possible values are: StandardRoom: rooms that have been created by a platform administrator, a domain administrator or by a end-user if the room creation self-service option has been activated. InstantMeetingRoom: rooms that have been created to host a Instant Whiteboarding session | |
| url | string | URL of the iObeya platform | |
| users_list | string | List of email adresses (comma separated) for the users with edition rights in the room | |
| users_rate | decimal | How much a room is used based on the number of users (i.e. nb_users / max_users) |
Click Download today’s room metrics.
Tip
The Room metrics export can be externalized and automated using iObeya’s API. See the developer guide for more information.
- Room connections
This section allows you to retrieve information about the connections by room:
- username,
- first name,
- last name,
- email,
- date and time of connection,
- creation date of the room.
- Click Download connection history (csv).
- Select the delimiter of the CSV.
- Select the date format.
- Select the time format.
- Click Download.
Congratulations!
You now have all the basic knowledge to start administrating your iObeya platform.
