QCD: Building your performance indicators dashboards
“By now you should be proficient with iObeya, but we also are aware that our QCD add-on can be technical and requires specific training.”

Sylvain 🧙
“From KPI dashboards to Action Management, this module will give you all the knowledge needed to be successful at digitizing your Performance Management System SQCDP to achieve operational excellence.”

Sara 🧚
“By now you should be proficient with iObeya, but we also are aware that our QCD add-on can be technical and requires specific training.”

Sylvain 🧙
“From KPI dashboards to Action Management, this module will give you all the knowledge needed to be successful at digitizing your Performance Management System SQCDP to achieve operational excellence.”

Sara 🧚
If you want to access a specific topic of the video here are the timings of the different sections:
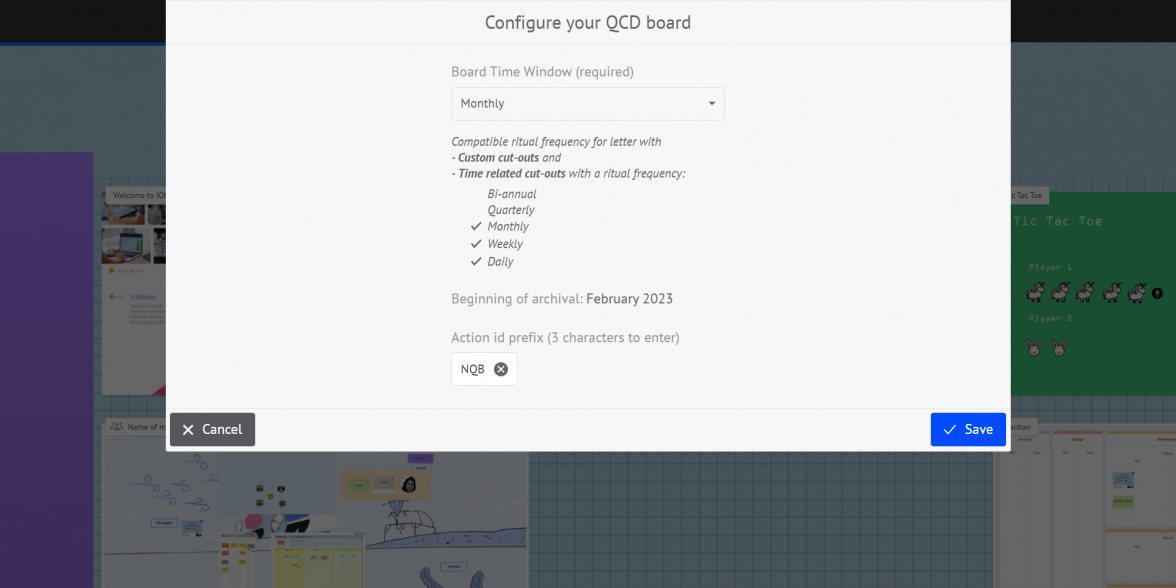
| 00:36 | QCD board |
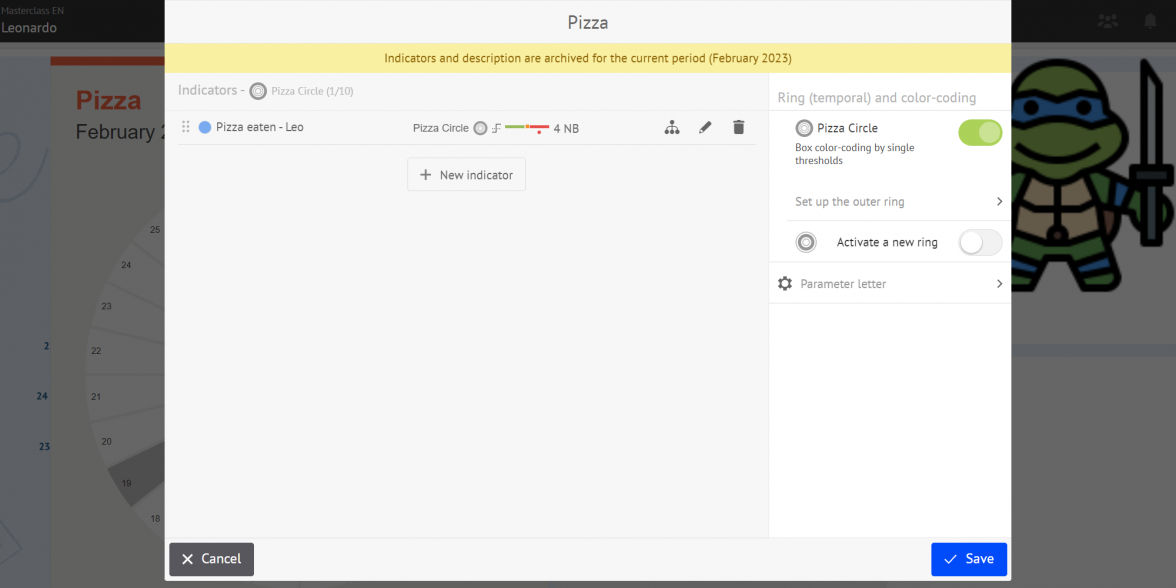
| 03:47 | QCD letter |
| 07:27 | Indicators |
| 21:28 | Actions |
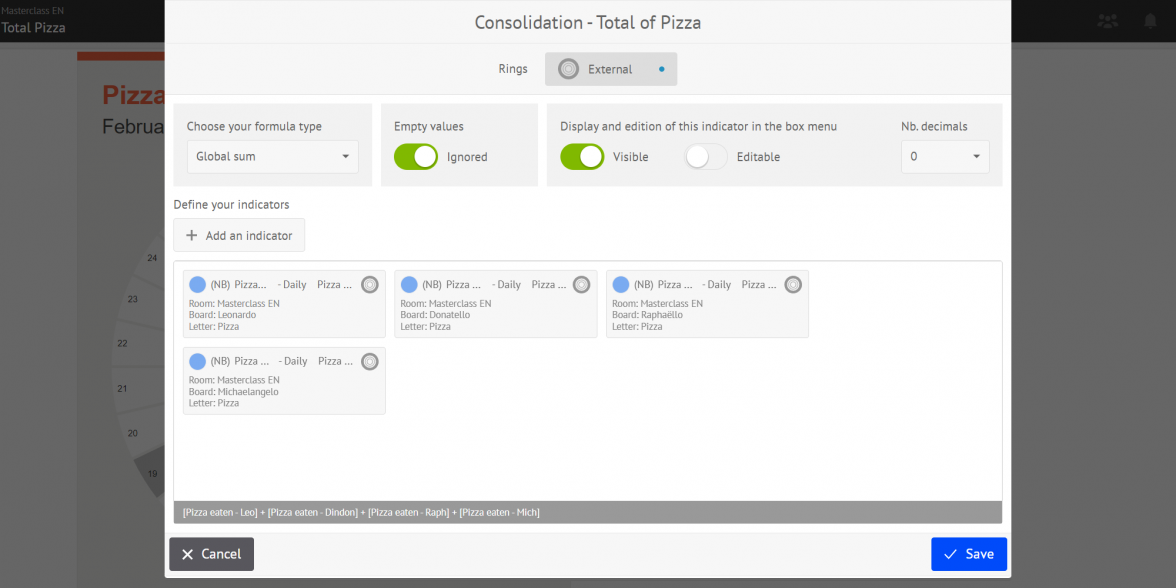
| 35:20 | Consolidation |
Now walk the talk!
Let’s put all of this into practice:
| Add several indicators on several circles of this letter (e.g Number of near accidents, Number of accidents…) | |
| Define the color coding to Single threshold | |
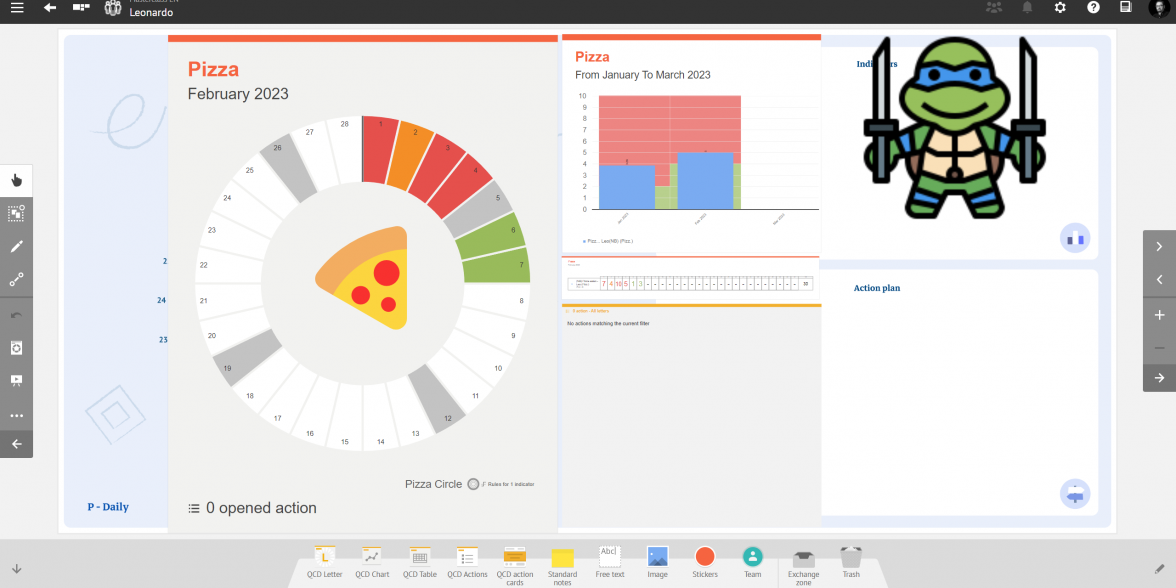
| Add values in the different boxes to populate the QCD letters on several days / week / month | |
| Test the indicator input interface by adding values while modifying the dates, indicators, selected circles |
| Add an Action table, a Graph and a Chart on the board | |
| Create an action from the Letter, fill the different fields out and check Create a related card | |
| Create a QCD board with a QCD table receiving escalated actions in a second room (e.g. Project Room) | |
| From the letter "Security" in the Team Room, create a QCD Action from the letter, then escalate it to the Project Room |
| In another QCD board create a Letter where you will consolidate data from 2+ indicators | |
| In this letter create a recipient indicator | |
| Tap the consolidation icon | |
| Define the consolidation formula: sum, average, or custom | |
| Pick source indicators from any room and board you have access to | |
| Trigger the Consolidated View |

Well done!
You have completed 4 modules of the Academy.
You can now complete all courses by undertaking the DCM Masterclass.
See you very soon!
XOXO Sylvain 🧙 & Sara 🧚
If you want to go further...
Discover the latest industry 4.0 module dedicated to Daily Capacity Management with iObeya Product Manager Nicola Olivetti.
Watch this webinar replay dedicated to Performance Management at all levels of a company including shop floor boards, KPI consolidation, issue escalation, and problem solving.
Use the iObeya connector on Microsoft Power Automate to create your own integration scenario automating workflows and processes. Here is a simple scenario using an Excel file as a source to populate performance management indicators in iObeya.

