Maximize Your Data Insights with Power BI and iObeya
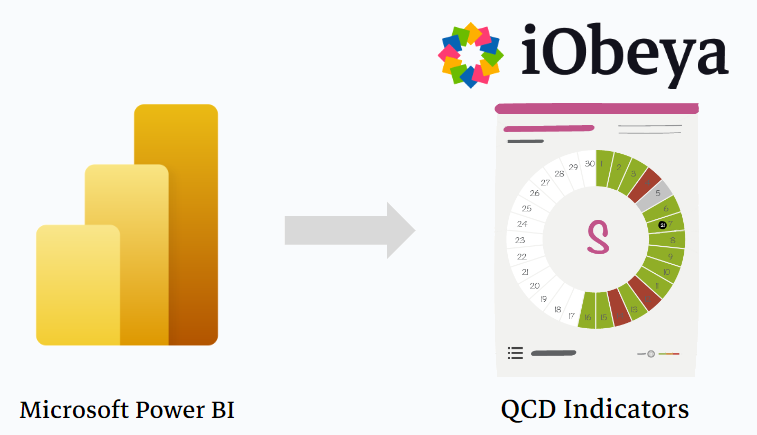
Power BI is a powerful data visualization tool that helps organizations turn data into actionable insights. With Power BI, you can create interactive dashboards and reports that provide a clear and concise view of your data, enabling you to make informed decisions that drive your business forward. However, as important as it is to have data at your fingertips, it's equally important to have a system in place to manage and act on that data. That's where iObeya comes in.
iObeya is a cloud-based visual management platform that helps teams work more efficiently and effectively. It provides a collaborative environment where teams can work together to analyze and act on data, and its Quality, Cost, and Delivery (QCD) indicators make it easy to visualize and track key performance metrics.
When Power BI and iObeya are combined, you can take your data visualization and decision-making capabilities to the next level. By automating the data extraction and transformation process with Power Automate and importing the data into iObeya, you can streamline your workflow, make better decisions, and drive your business forward.
The flow described here can easily be triggered - manually or automatically - following this other article.
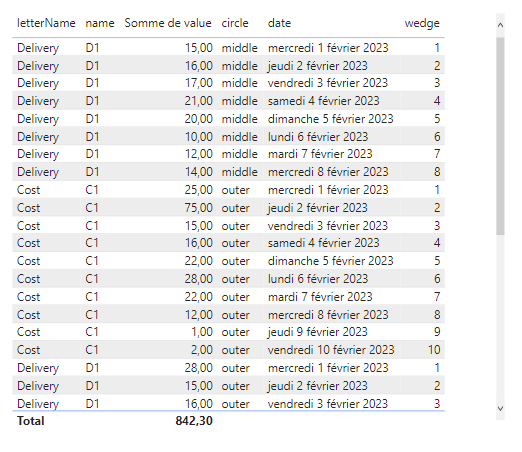
Step 1: Create a Power BI Dataset with Indicator Data
Before you can extract data from Power BI, you need to have a Power BI dataset with indicator data. This dataset should contain all of the data that you want to extract and import into iObeya. If you don't have a dataset, create one in Power BI and add the indicator’s data that you want to work with.
Step 2: Create a Power BI flow
To get started with creating a flow in Power Automate, follow these steps:
- Go to the Power Automate home page and sign in to your account. If you don't have an account, you can create one for free.
- Once you're signed in, click on the “Create a flow” button on the top navigation menu. This will open the flow wizard, which will guide you through the process of creating your flow.
- In the flow wizard, you'll first need to select a trigger for your flow. This is the event that will start the flow and initiate the data extraction and transformation process. For example, you can select the “Power BI” trigger and then choose the specific trigger “On Power BI button clicked”. This will set the foundation for your data extraction and transformation process.
Step 3: Effortlessly Extract Data from Power BI
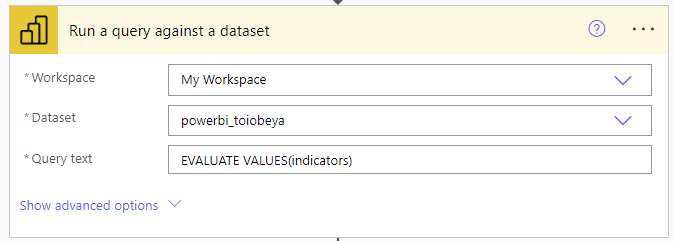
With the trigger set, it's time to extract the data from Power BI.
- Add a “Run a query against a dataset” action to the flow and select your workspace.
- Choose the specific dataset that you want to extract data from
- Set the “Query Text” with a DAX syntax (ex: EVALUATE VALUES(indicators))
Step 4: Transform Your Data into Insights
Click on Sing in to start the OAuth authentication process. You will have
to provide the credentials of a user account in iObeya that can access
the rooms and the boards you want to interact with and authorize Power Automate to use this account to access the data. If the information provided are correct, both connectors should be marked as ready to be used with a valid connection.
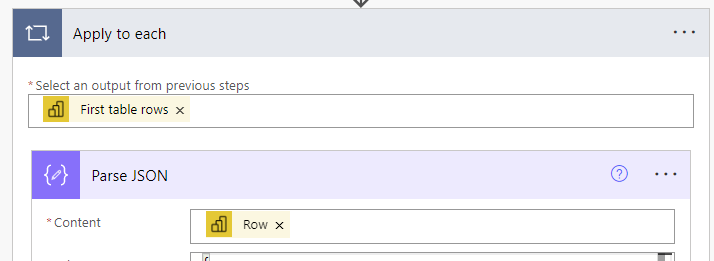
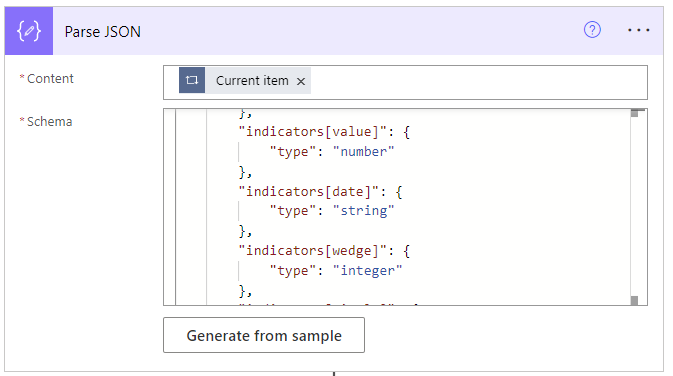
Data extraction is just the beginning. Power Automate's “Parse JSON” action allows you to transform the data into ready to use variables that are easy to select into the next iObeya action. Select “Row” as Content to loop through each data extracted from Power BI.
Step 5: Seamless Integration with iObeya
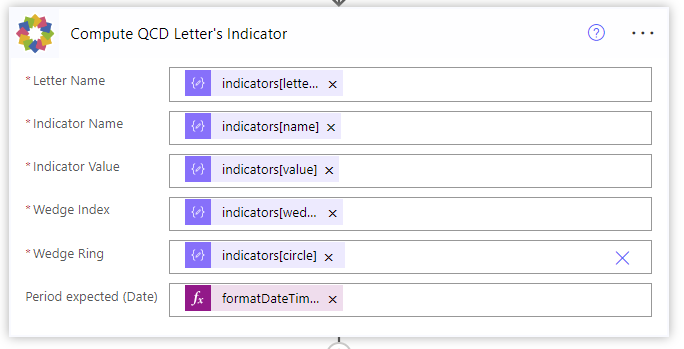
With the data transformed, it's time to import it into iObeya's Quality, Cost, and Delivery (QCD) indicators. The iObeya Power Automate Connector makes this process simple and seamless. Add a “Compute QCD Letter’s Indicator” action to the flow, specify the specific QCD indicator that you want to import the data into. Map the data from Power Automate to the fields in the QCD indicator. You may use formulas and functions to manipulate the data and turn raw data into valuable insights.

Outside the loop, Add a “Update QCD Indicators” and select the board where your letters are and watch as the data is imported into iObeya.
Step 6: Visualize Your Data and Make Informed Decisions
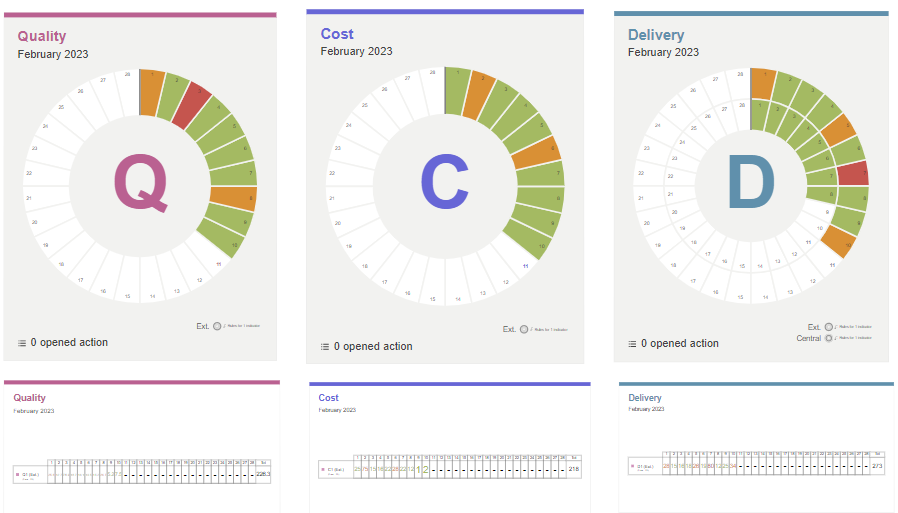
Now that your data is imported into iObeya, it's time to start visualizing it. iObeya's QCD indicators provide a visual representation of your data, allowing you to quickly identify trends and patterns. With this information at your fingertips, you can make informed decisions that drive your business forward.
In conclusion, Power BI and iObeya are a powerful combination that can transform your data visualization and decision-making process. Automate your data extraction and transformation processes, visualize your data with ease, and make informed decisions based on valuable insights.
Looking for more ?
- Do you want to learn more about this connector capabilities? Browse the iObeya connector documentation
- You are using another RPA/iPaaS platform than Power Automate? Browse the Facade API documentation to discover the API services used with Power Automate
- Interested to have an overview of the integration capabilities of the iObeya platform? Access the integrations page
If you have any questions or would like more information about using iObeya APIs for your business, please don't hesitate to contact us at integrations-support@iobeya.com. Our team of experts is available to provide additional guidance and support, and can also offer personalized demonstrations of these powerful tools to help you get the most out of them. We look forward to hearing from you and helping you achieve your business goals with iObeya.
Type of integration
PowerBI via PowerAutomate Flow
Tags
Tools

