Analyzing Your QCD Actions with iObeya's API and Power BI

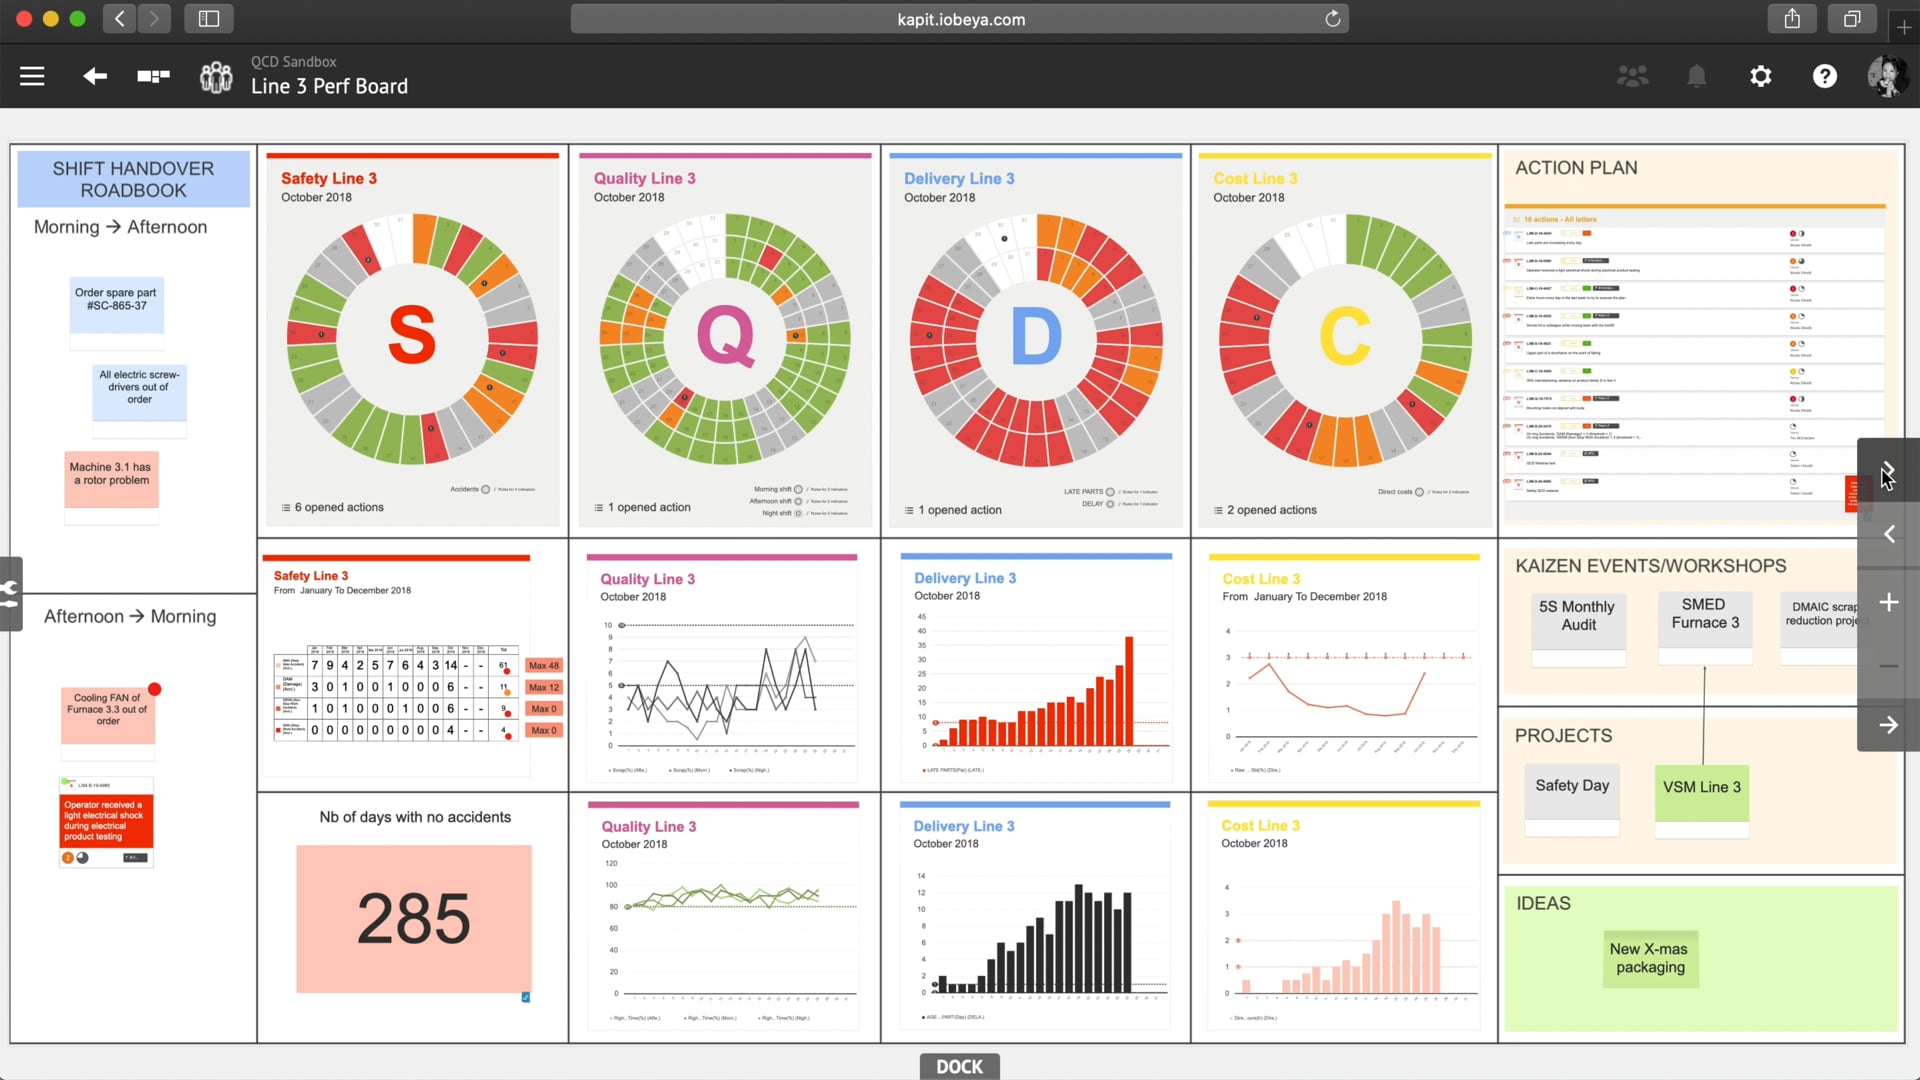
The iObeya platform provides a powerful tool for tracking and managing Quality Control Deployment (QCD) actions within your organization. However, for those looking to take their analysis to the next level, the iObeya API offers a way to extract this valuable data and use it for custom analysis and visualization. In this article, we will show you how to extract QCD actions from iObeya, store them in a data lake, and use Power BI to create custom visualizations and insights into your QCD performance.

Step 1: Extract QCD Actions from iObeya
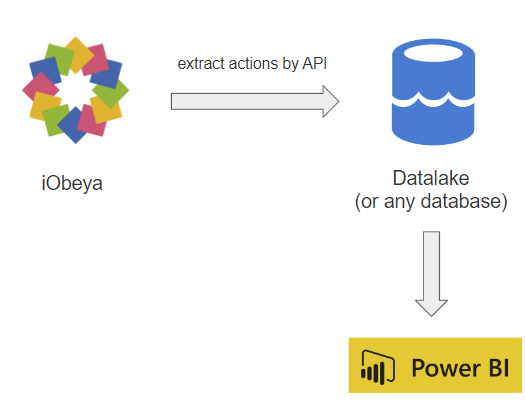
The first step in this process is to extract the QCD actions from iObeya using the iObeya API. The iObeya API uses a JWT Token for authentication, which can be obtained through the iObeya platform. The endpoint for extracting QCD actions is https://your_platform.api.iobeya.com/v0/servlet/qcd/api/extract/actions.
You can also take a look at this article which describes in detailled how to get such data directly in Power BI. The mechanism for manipulating API will be similar.
Step 2: Store Data in a Data Lake
Once you have extracted the QCD actions from iObeya, the next step is to store this data in a data lake for later use. A data lake is a centralized repository that allows you to store structured and unstructured data at any scale. This makes it a perfect solution for storing large amounts of data from multiple sources, such as iObeya's API.
Step 3: Visualize Data with Power BI
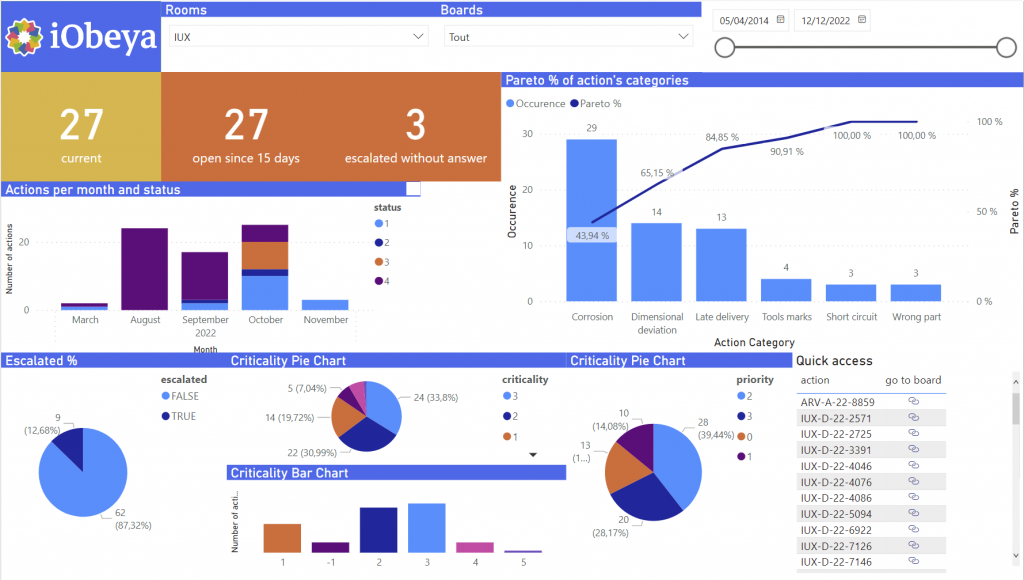
Finally, the last step in this process is to use Power BI to visualize and analyze the data stored in your data lake. Power BI is a powerful data visualization tool that allows you to create interactive reports and dashboards that provide insights into your data. In this step, you will connect Power BI to your data lake and start creating custom visualizations, such as Pareto charts, to track and analyze your QCD actions and performance.
In conclusion, extracting QCD actions from iObeya and storing them in a data lake provides a powerful tool for custom analysis and visualization. With Power BI, you can turn this data into valuable insights that can be shared and used to make informed decisions about your QCD performance.
Learn More About Power BI and iObeya
If you would like to learn more about these powerful tools and how they can benefit your business, we recommend checking out the following resources:
- Detailed information about the properties of actions that can be extracted using iObeya's API, can be found on the official iObeya API documentation. The API documentation provides a comprehensive list of all the available properties, including the structure of the JSON response, and more. This information can be useful if you want to get more granular with your data analysis and extraction process.
- The official Microsoft Power BI website, which offers tutorials, support forums, and a wealth of information on using Power BI to gain insights from your data.
If you have any questions or would like more information about using Power BI and iObeya for your business, please don't hesitate to contact us at integrations-support@iobeya.com. Our team of experts is available to provide additional guidance and support, and can also offer personalized demonstrations of these powerful tools to help you get the most out of them. We look forward to hearing from you and helping you achieve your business goals with Power BI and iObeya.
Type of integration
Facade API
Tags
Tools


